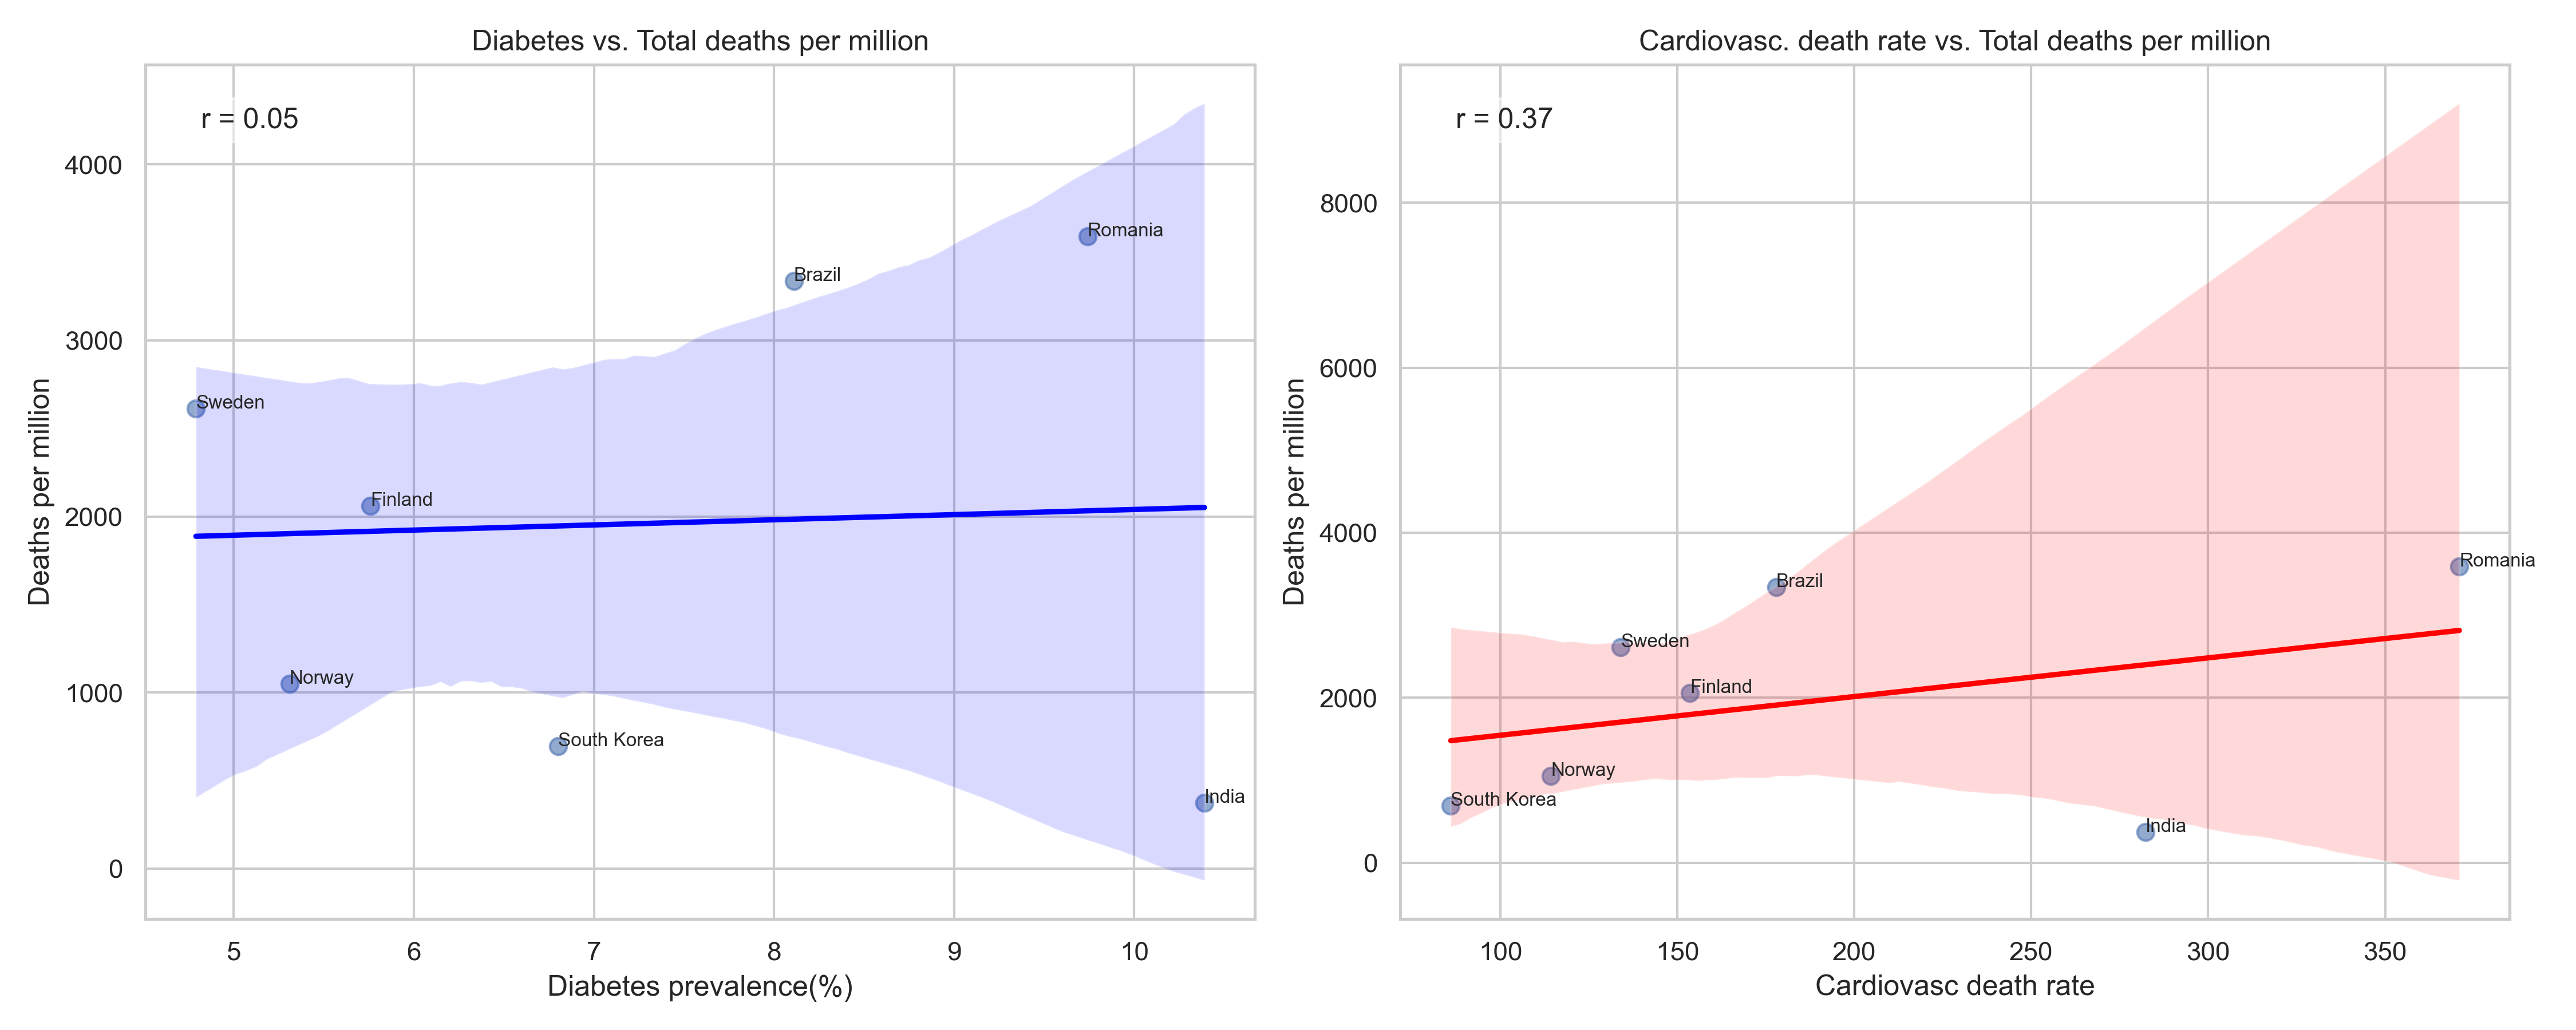
Deaths from Diabetes and Cardiovascular Diseases
This image shows the trends of deaths related to diabetes and cardiovascular issues during the COVID-19 pandemic.
Key pandemic events in Norway shown alongside case evolution.
This visualization illustrates the total number of COVID-19 cases and deaths recorded in Norway.
The graph displays the daily reported cases and deaths in Norway.
This interactive chart shows the number of hospitalizations due to COVID-19 over time in Norway.
This chart compares COVID-19 case trends with the timeline of government restrictions.
This image shows the trends of deaths related to diabetes and cardiovascular issues during the COVID-19 pandemic.
Forecast of COVID-19 cases using the ARIMA model for the years 2020 to 2022.
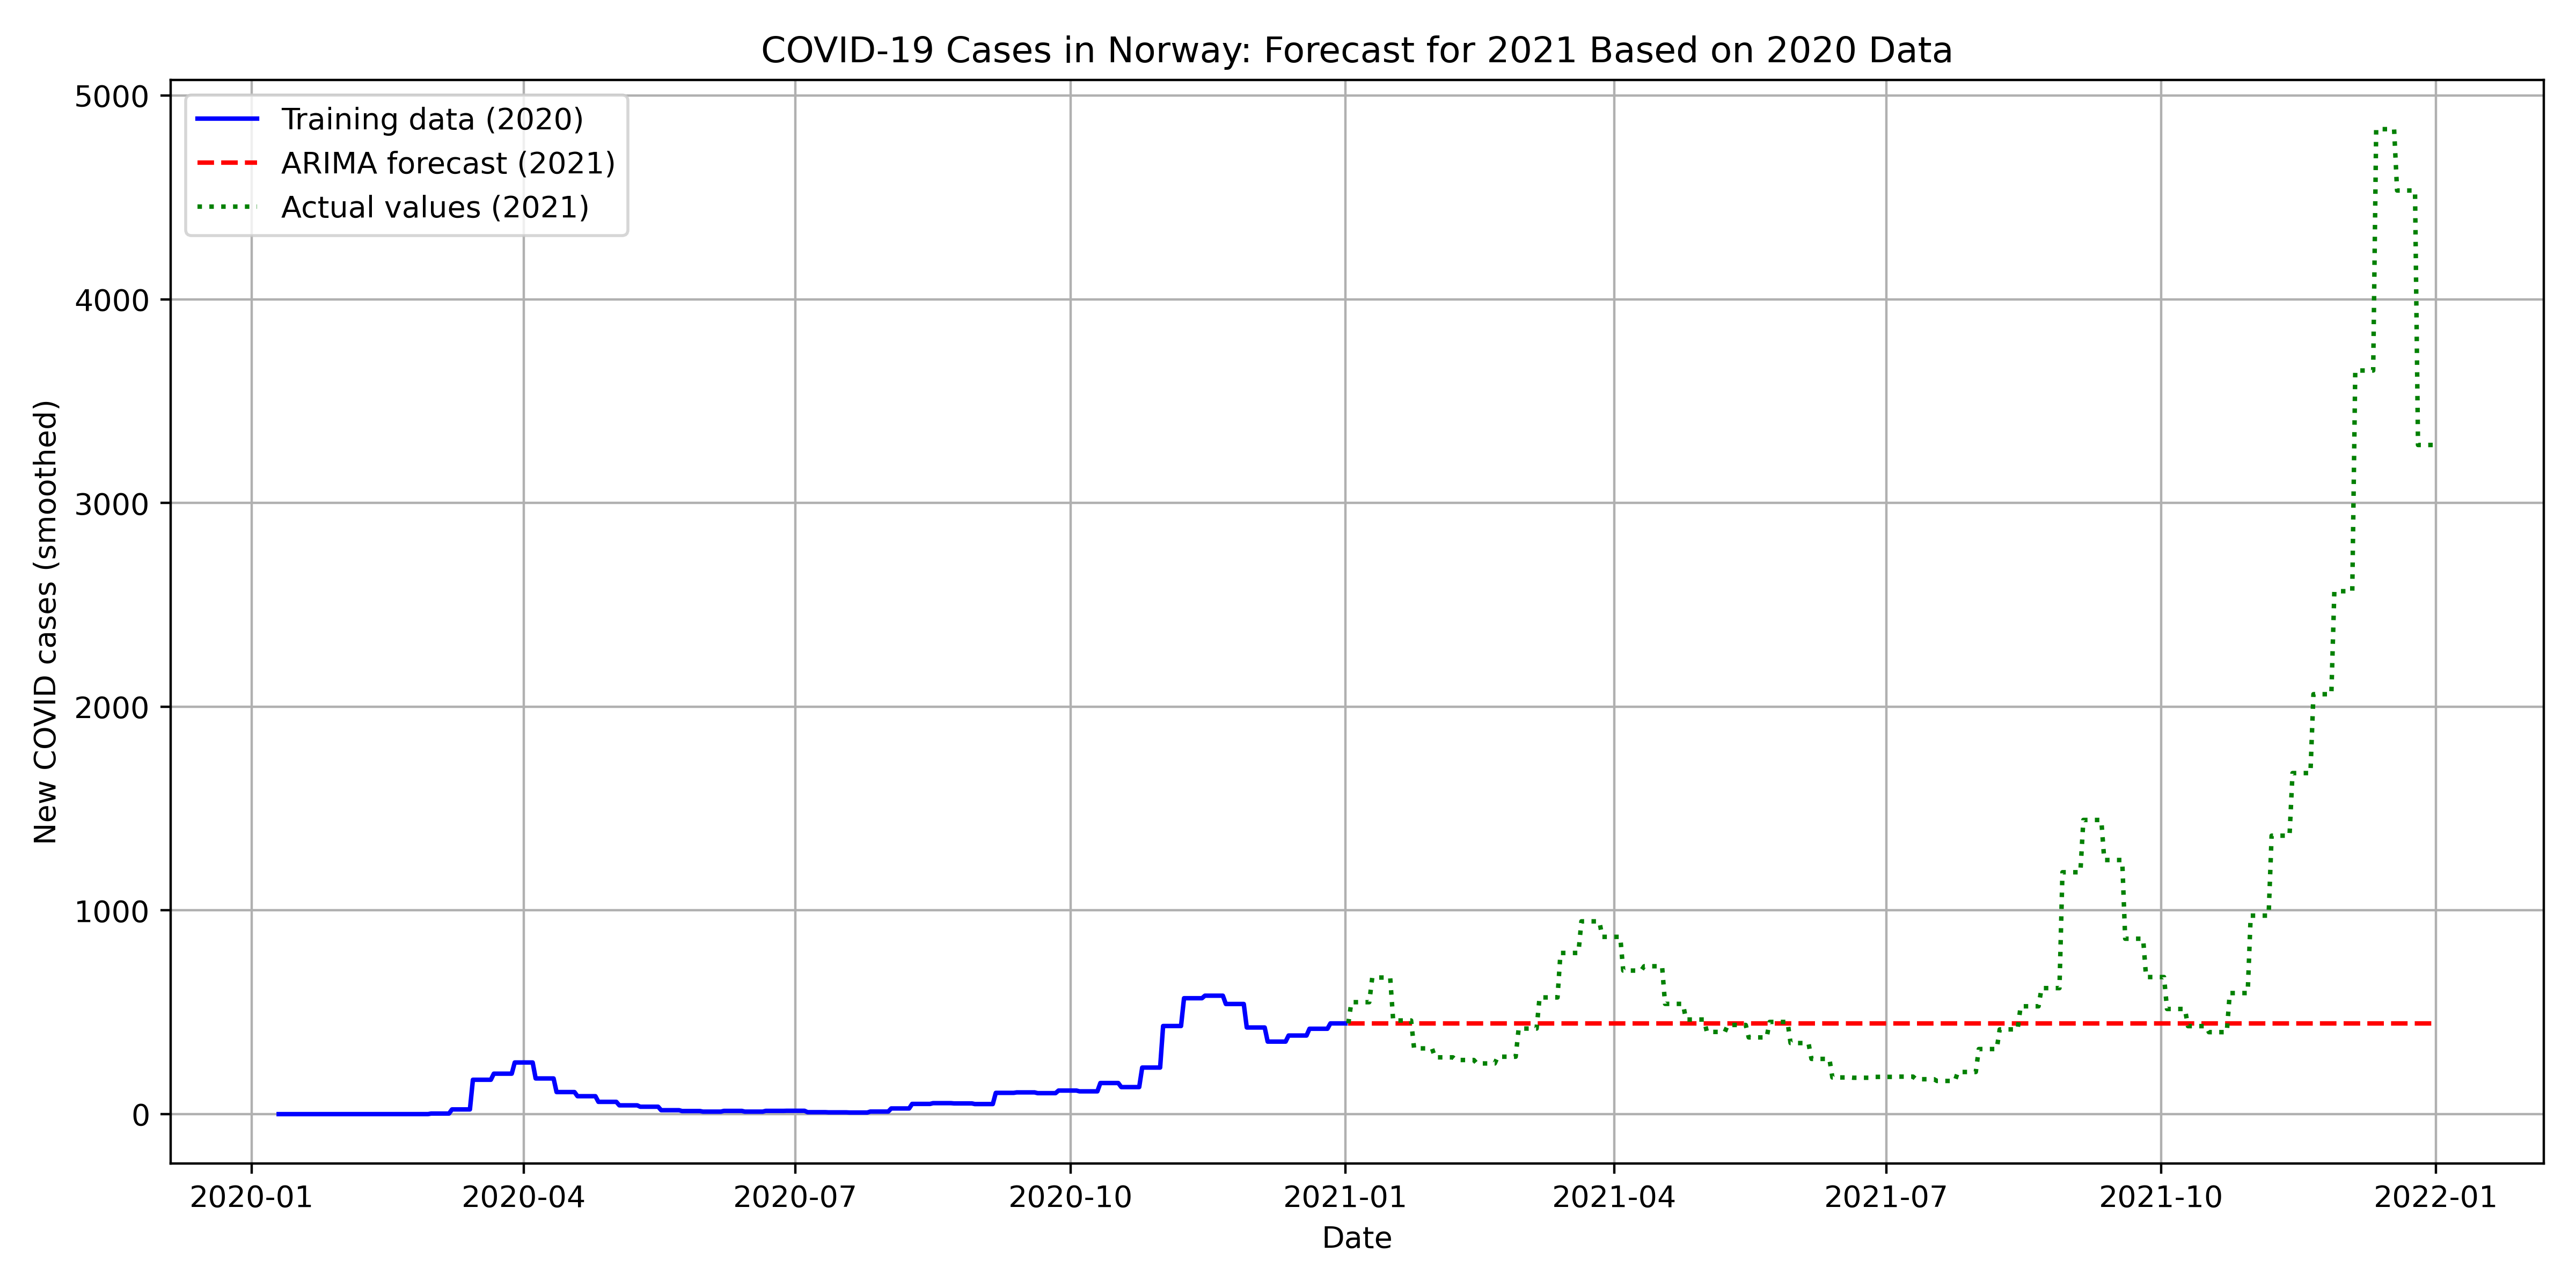
Forecast of COVID-19 cases using ARIMA for 2020–2021.
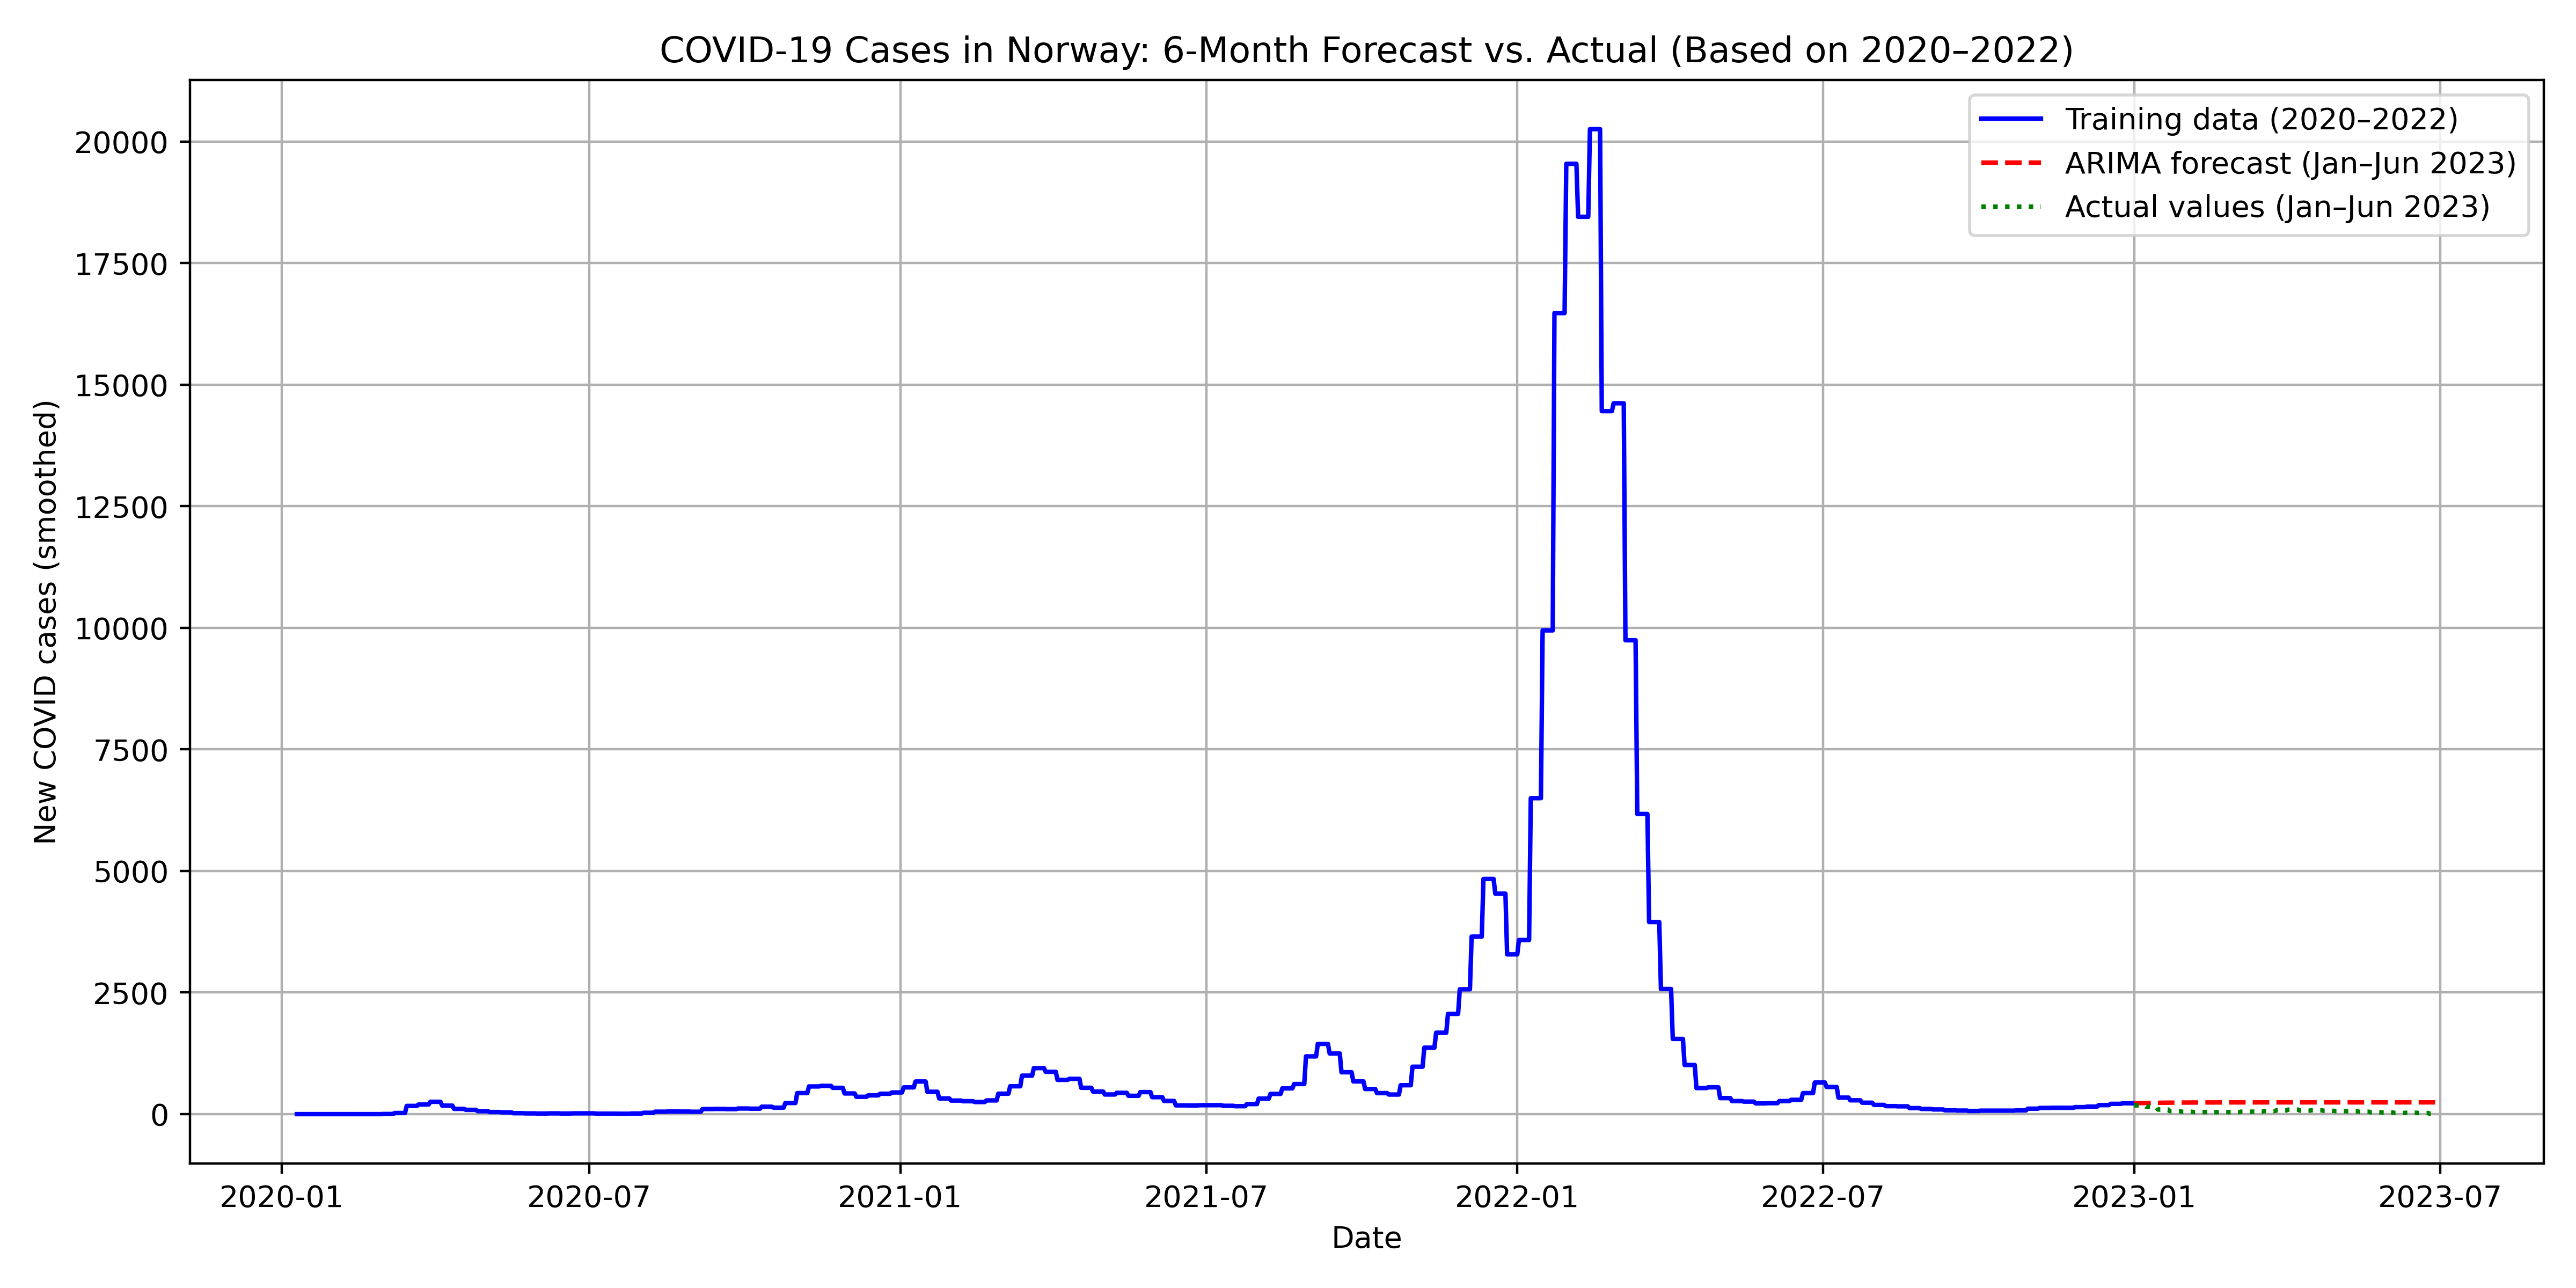
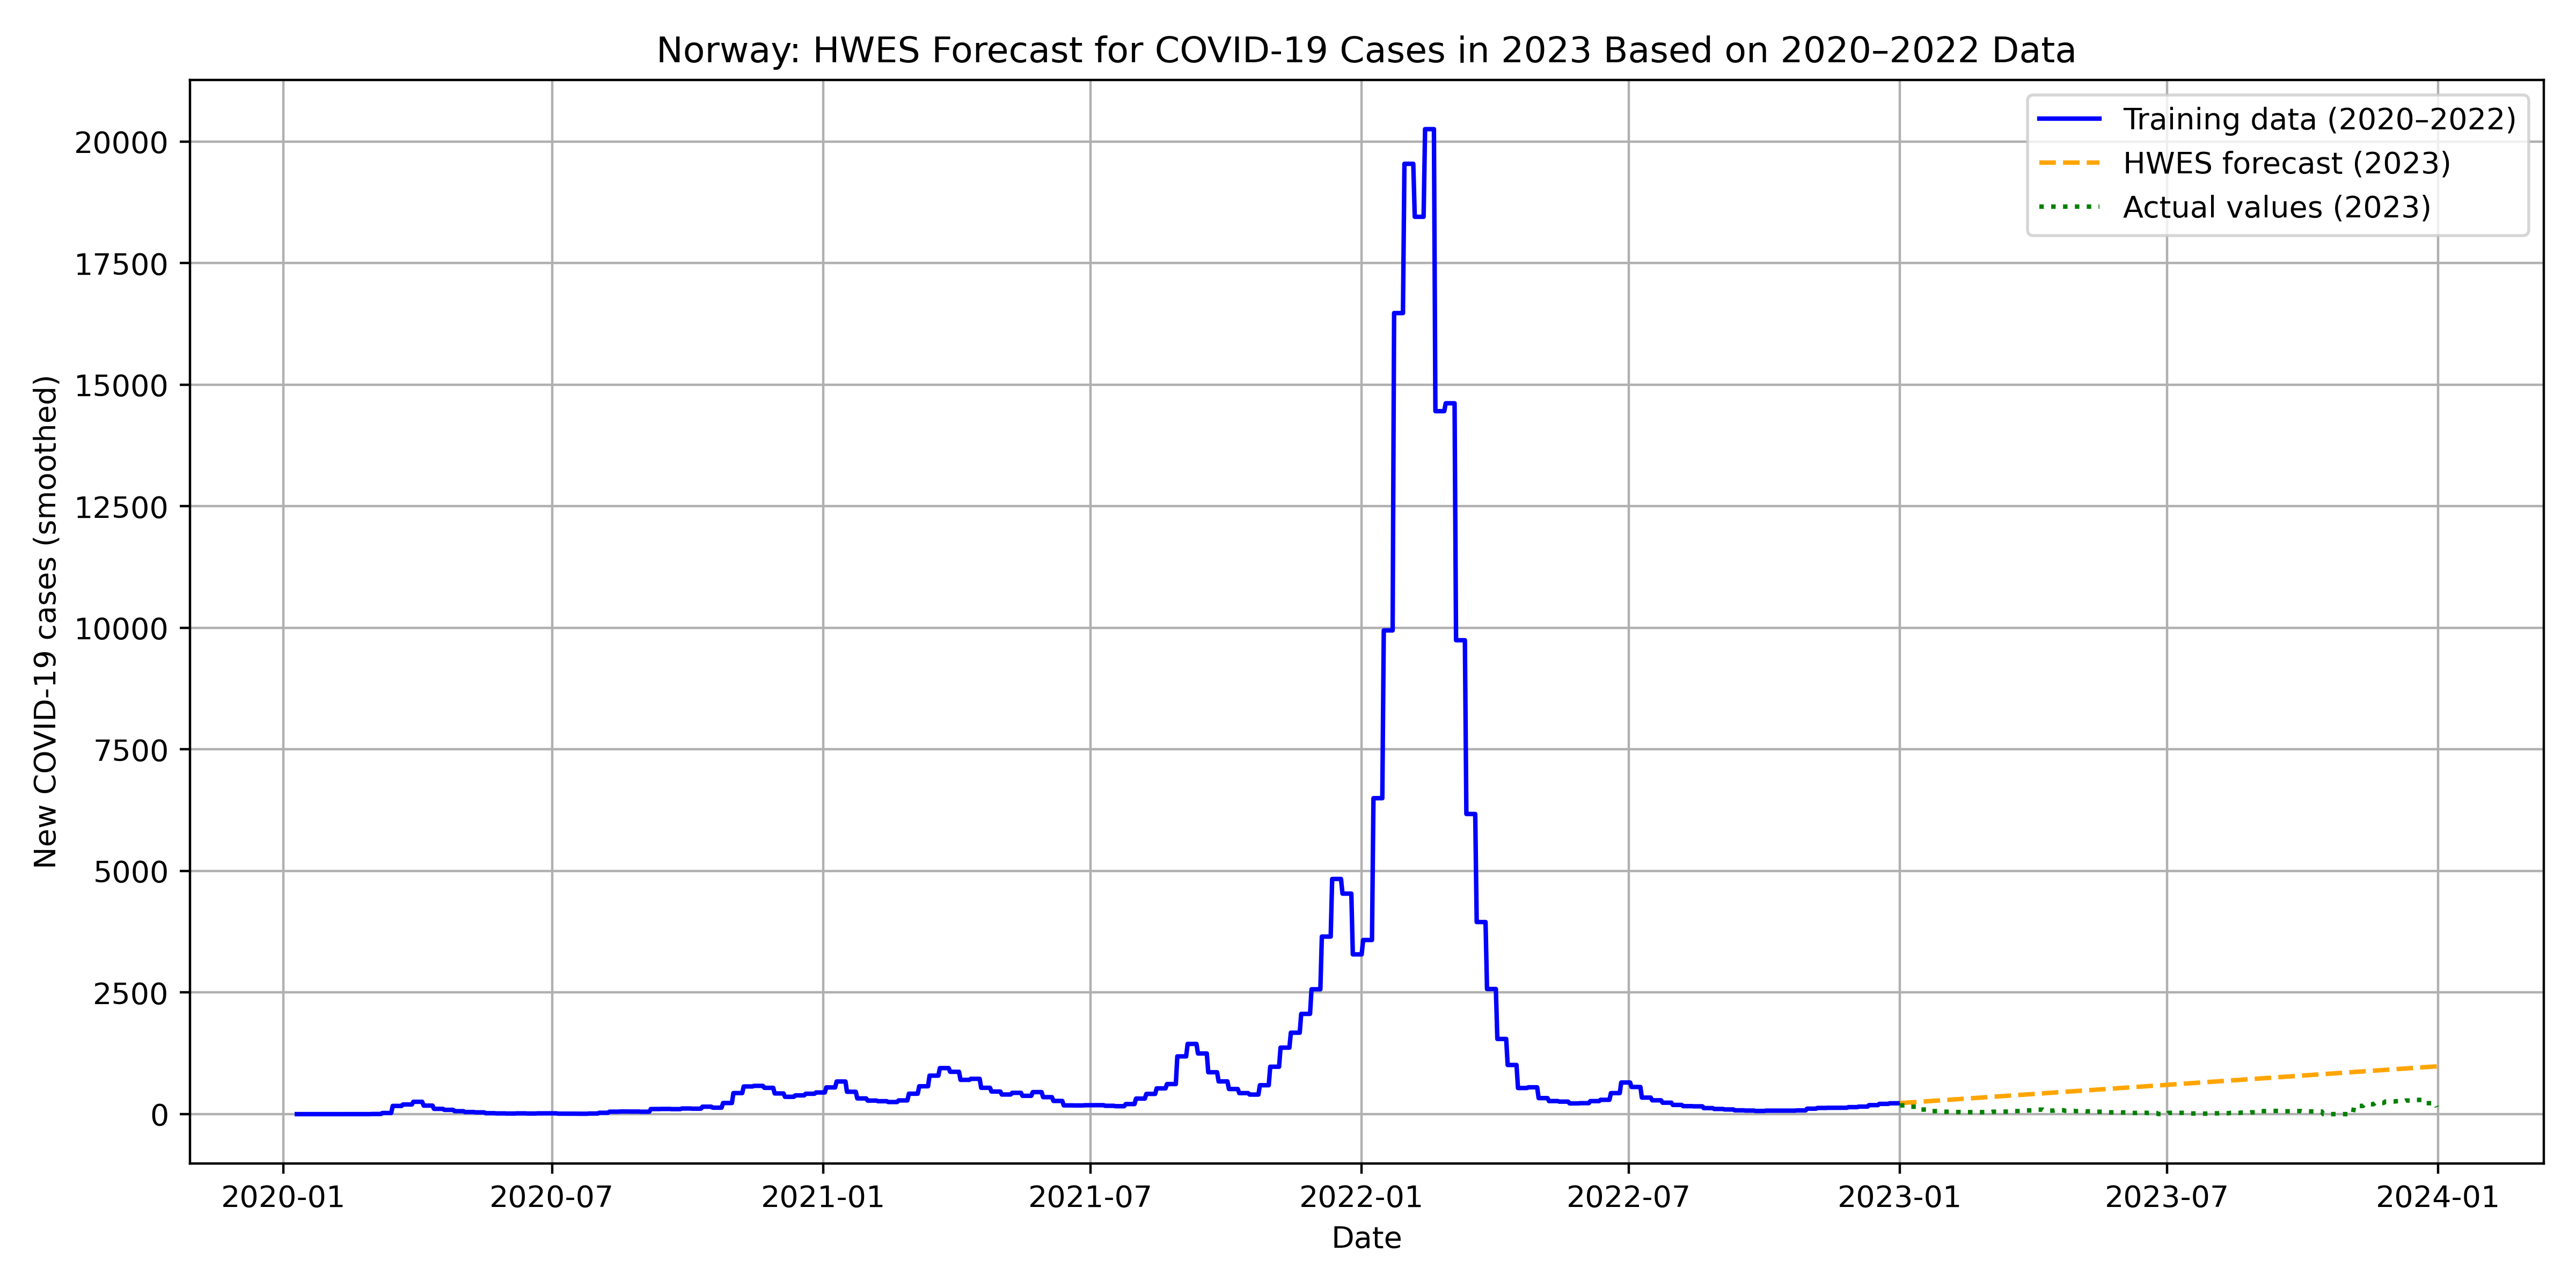
Holt-Winters Exponential Smoothing forecast for COVID-19 cases in 2023.
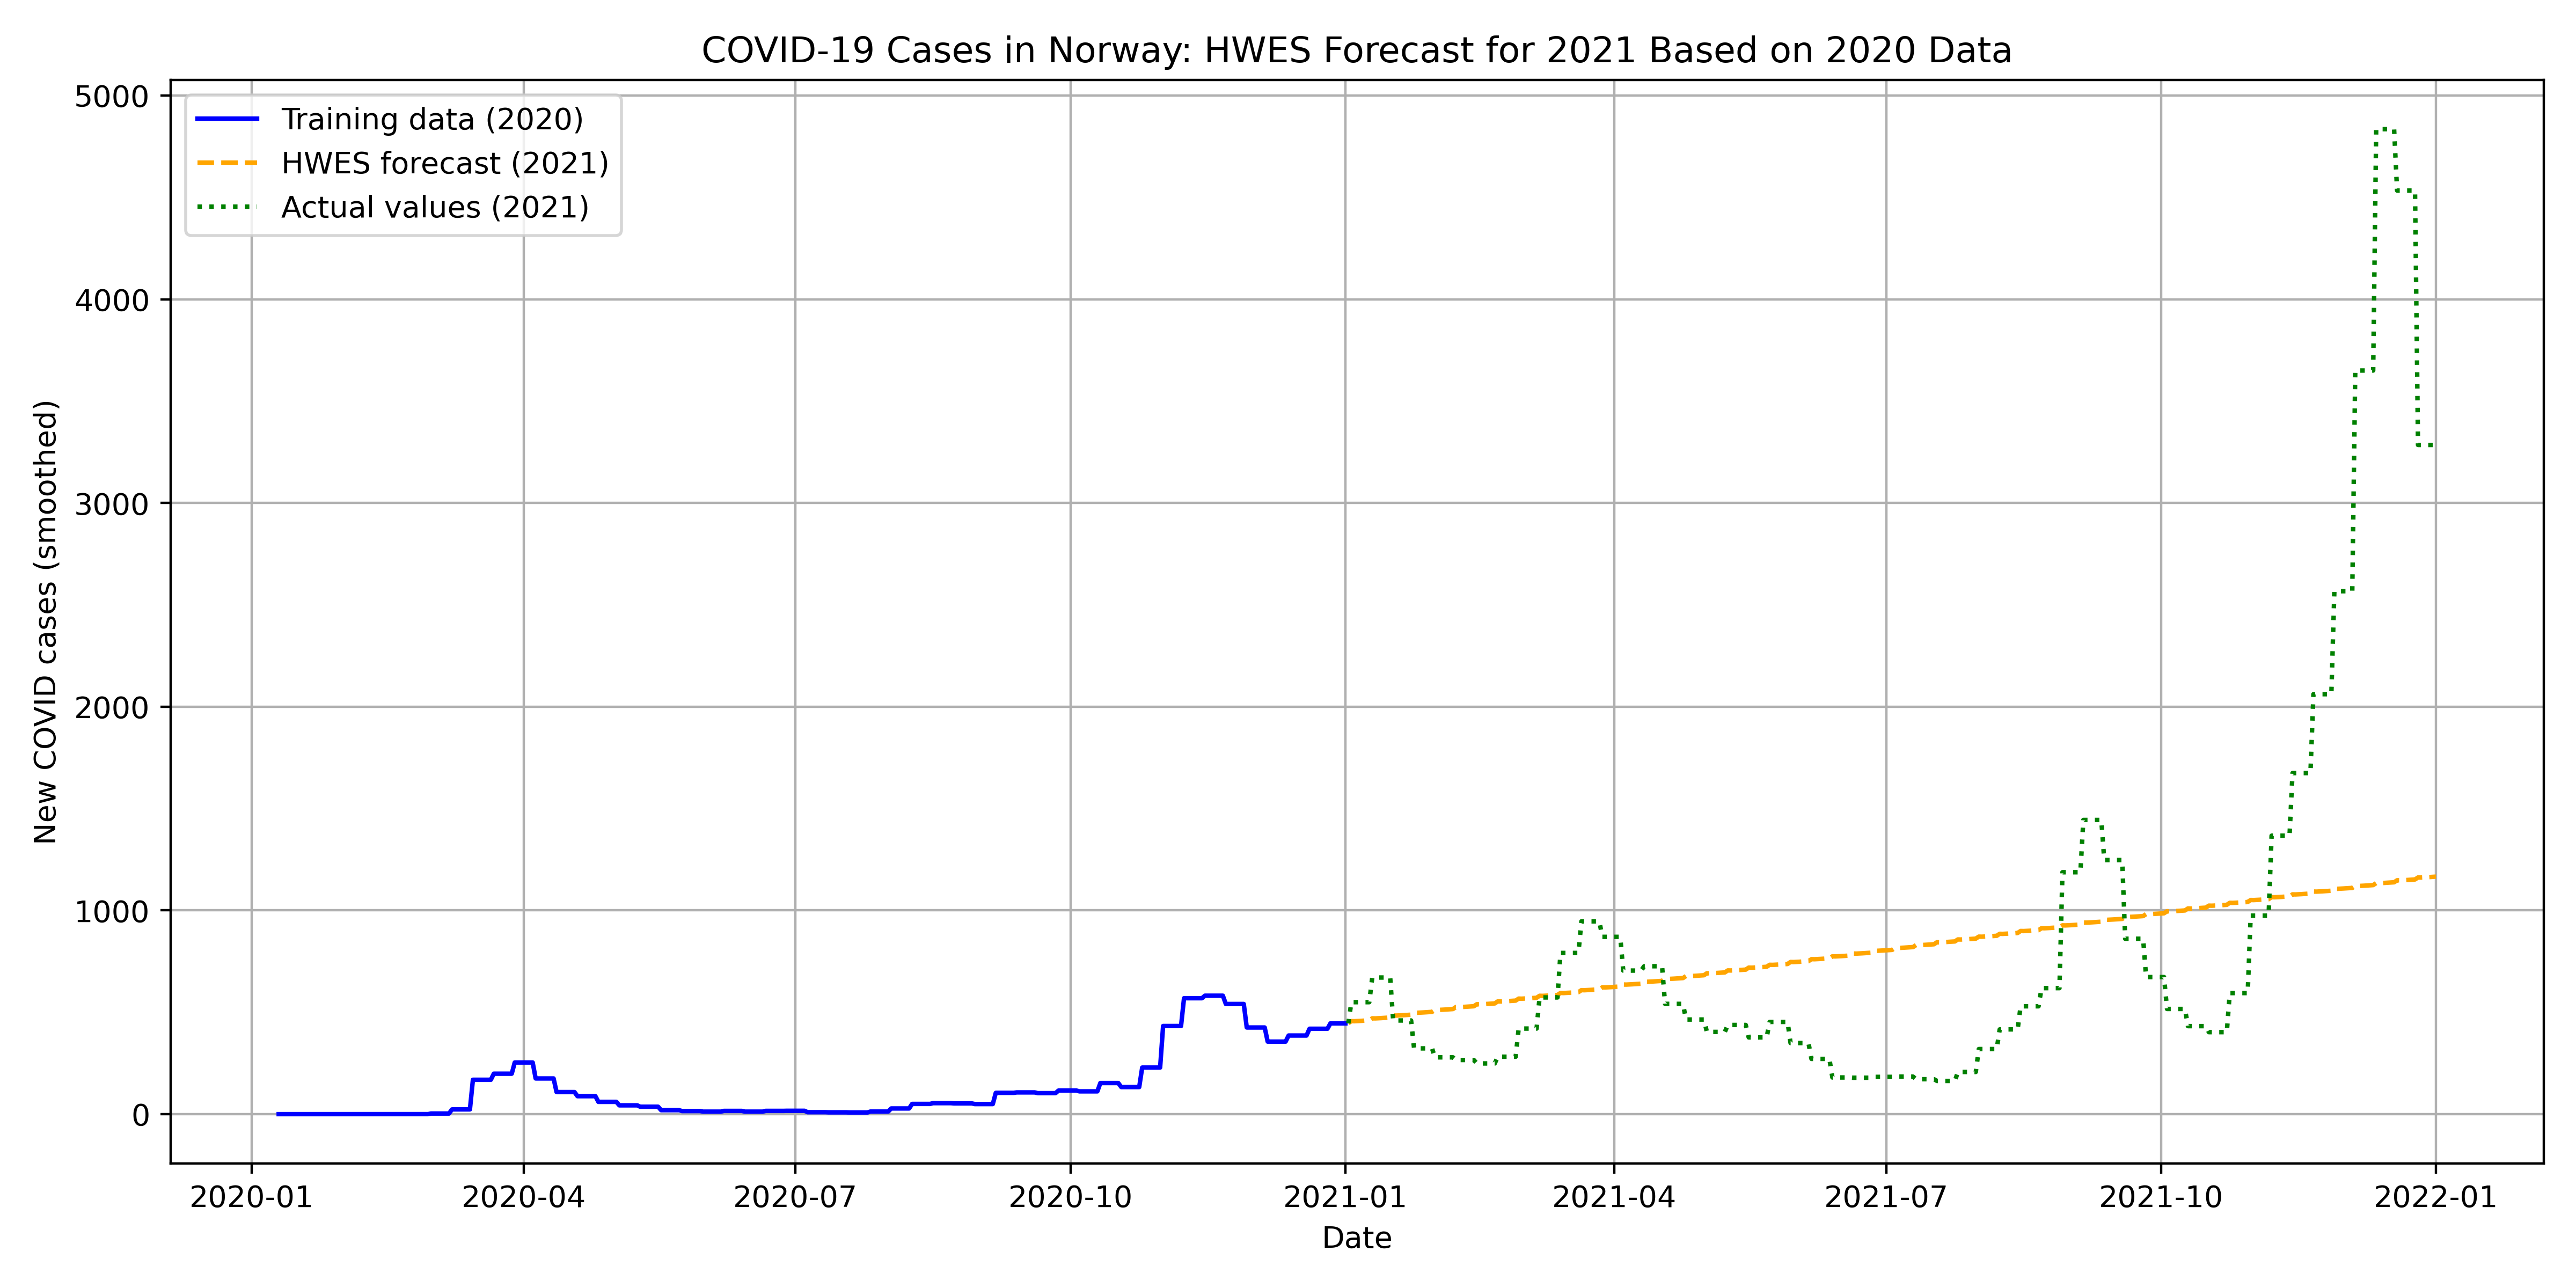
Forecast using HWES model for the year 2021.
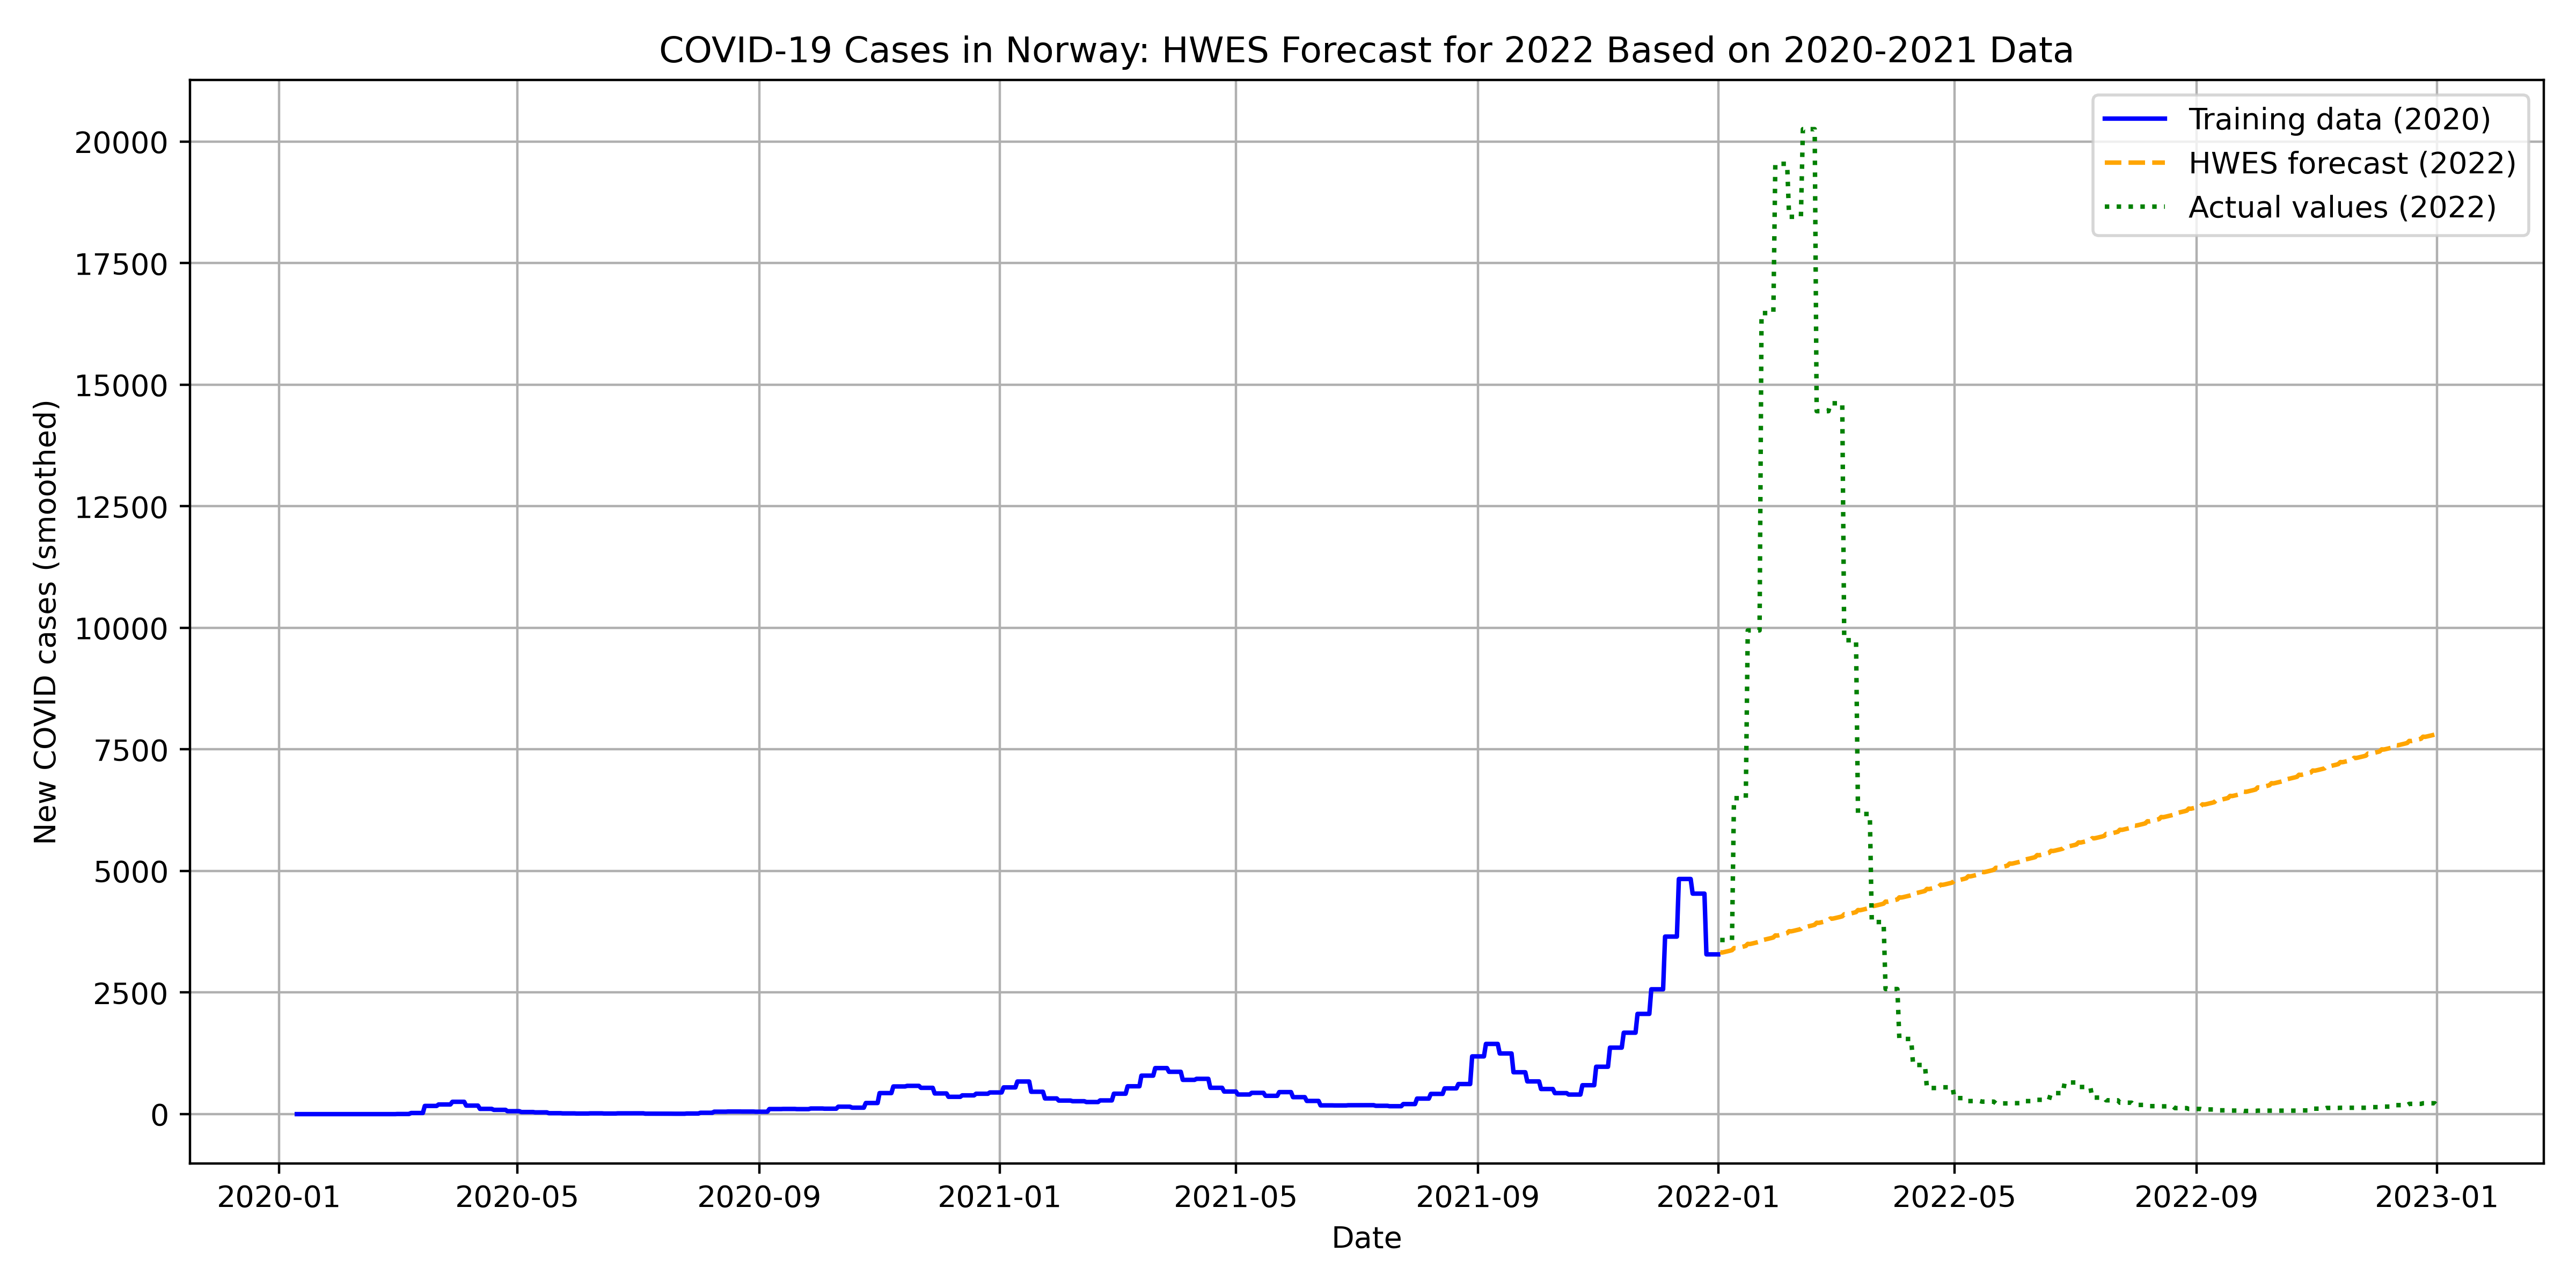
HWES model prediction for 2022.
Correlation between vaccination levels and death rates in Norway.
Monitoring new case trends and vaccination efforts in Norway.
Analysis of COVID-19 deaths and vaccination progression in Spain.
Comparison between new COVID-19 cases and vaccination rates in Spain.
Relationship between deaths and vaccination in Brazil during the pandemic.
Visualization of Brazil’s vaccination efforts and their impact on case numbers.
A comparative bubble chart showing vaccination coverage and death rates.
Interactive multi-country chart showing daily cases with toggle functionality.
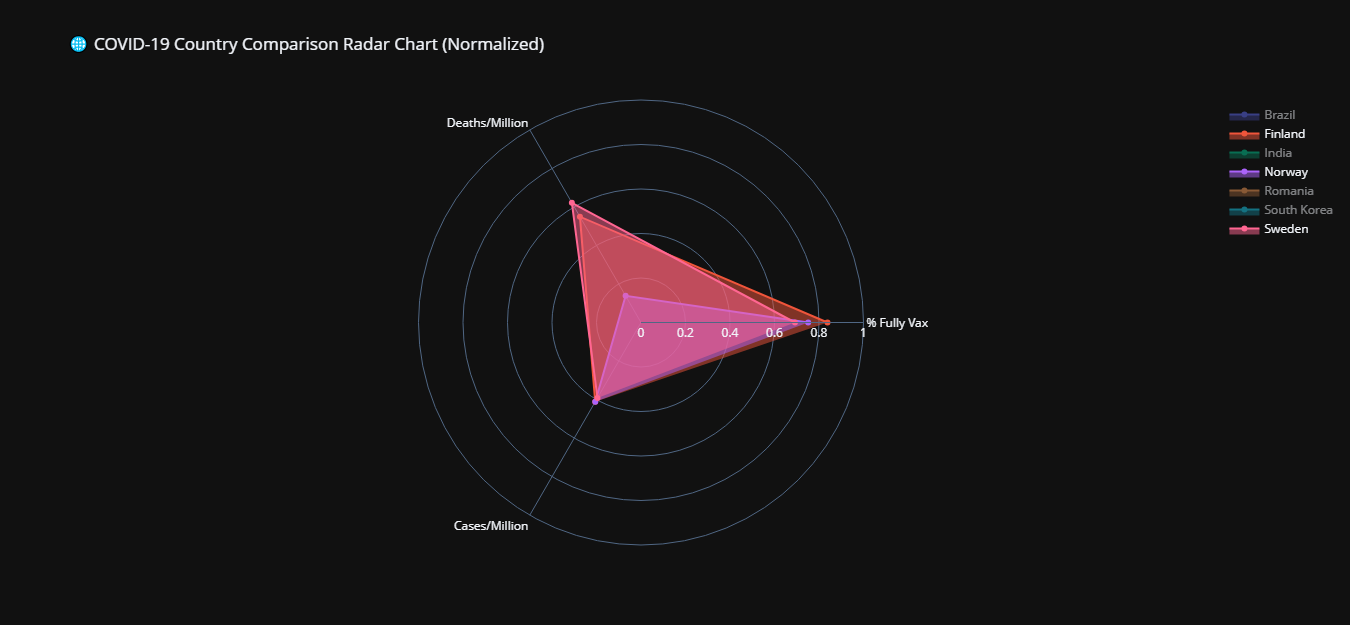
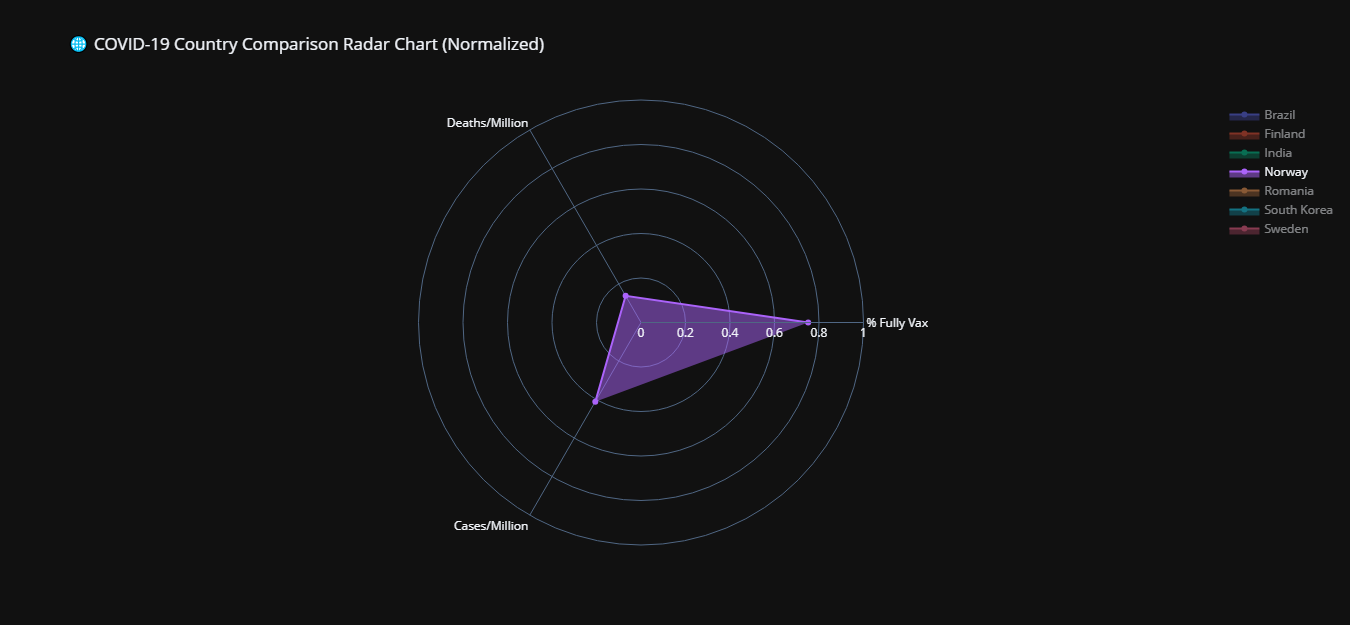
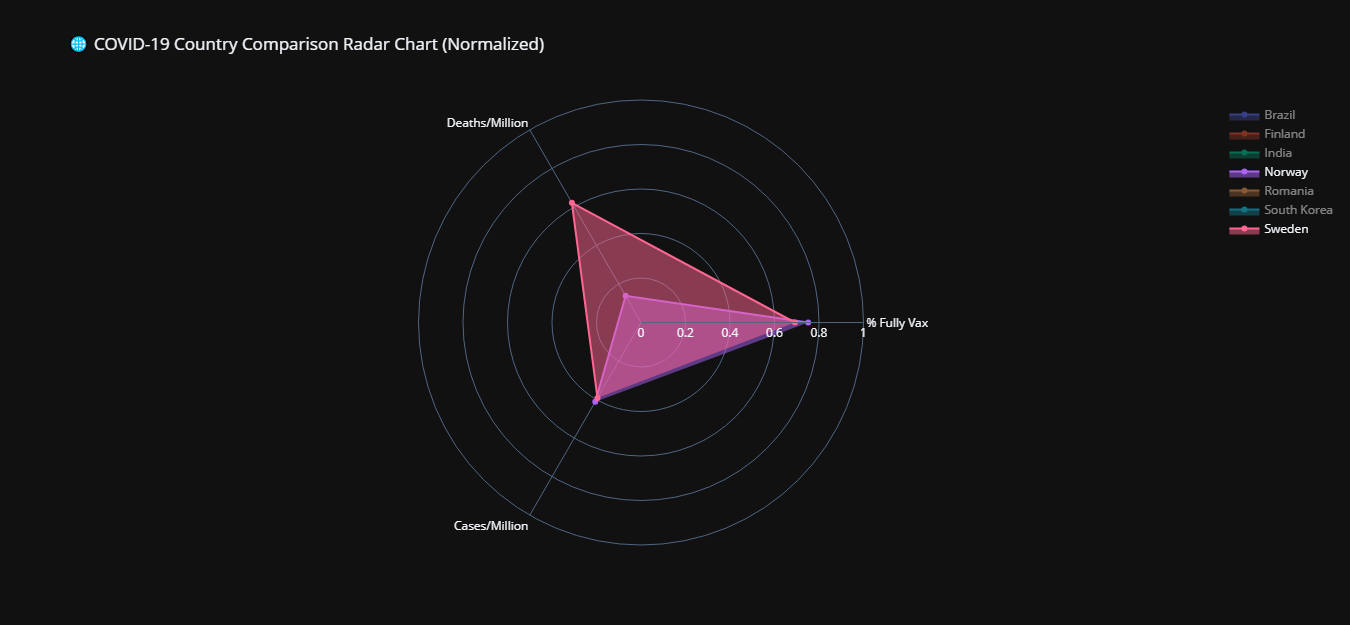
Radar visualization of COVID-19 metrics in Norway.
Radar chart displaying COVID-19 impact dimensions in Sweden.
Radar chart of Finland's performance on various COVID-19 indicators.