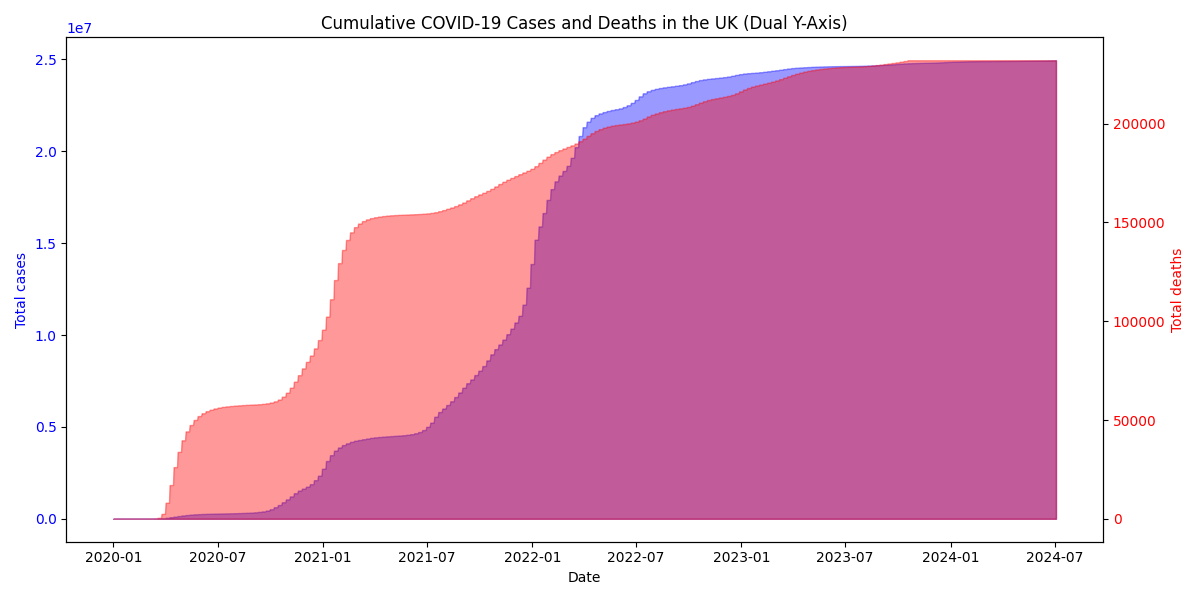
Cumulative COVID-19 Cases and Deaths in the UK
Cumulative cases and deaths from COVID-19 in the UK from 2020 to 2024. There is a sharp increase in infections in the first two years of the pandemic and a significant slowdown in the increase in deaths after 2022./div>
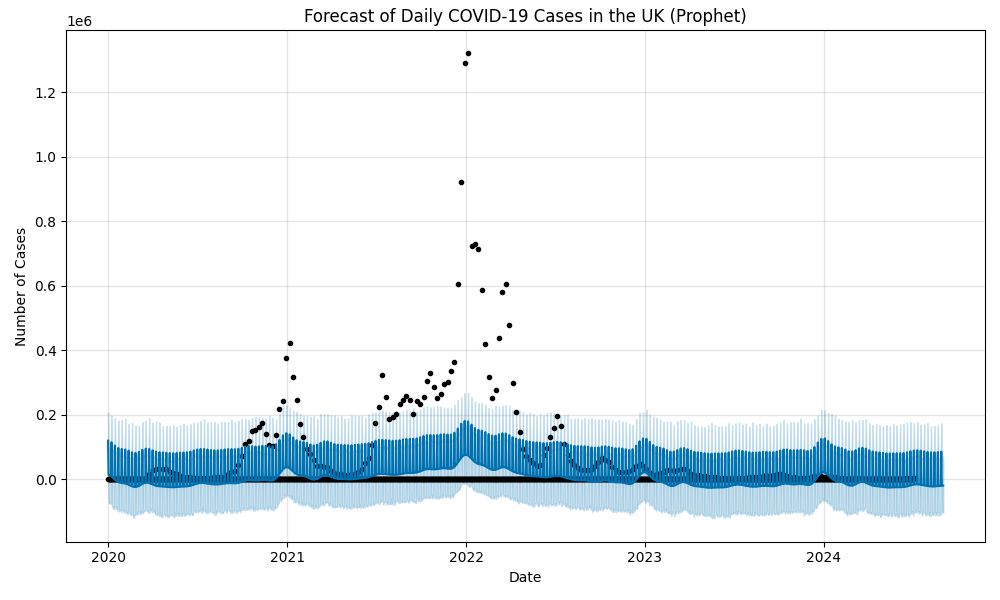
Forecast of Daily COVID-19 Cases in the UK
Forecast of daily COVID-19 cases in the UK using the Prophet model. The graph shows historical data and a 60-day forecast with uncertainty bands.
7-Day Rolling Avarage of COVID-19 Cases and Deaths
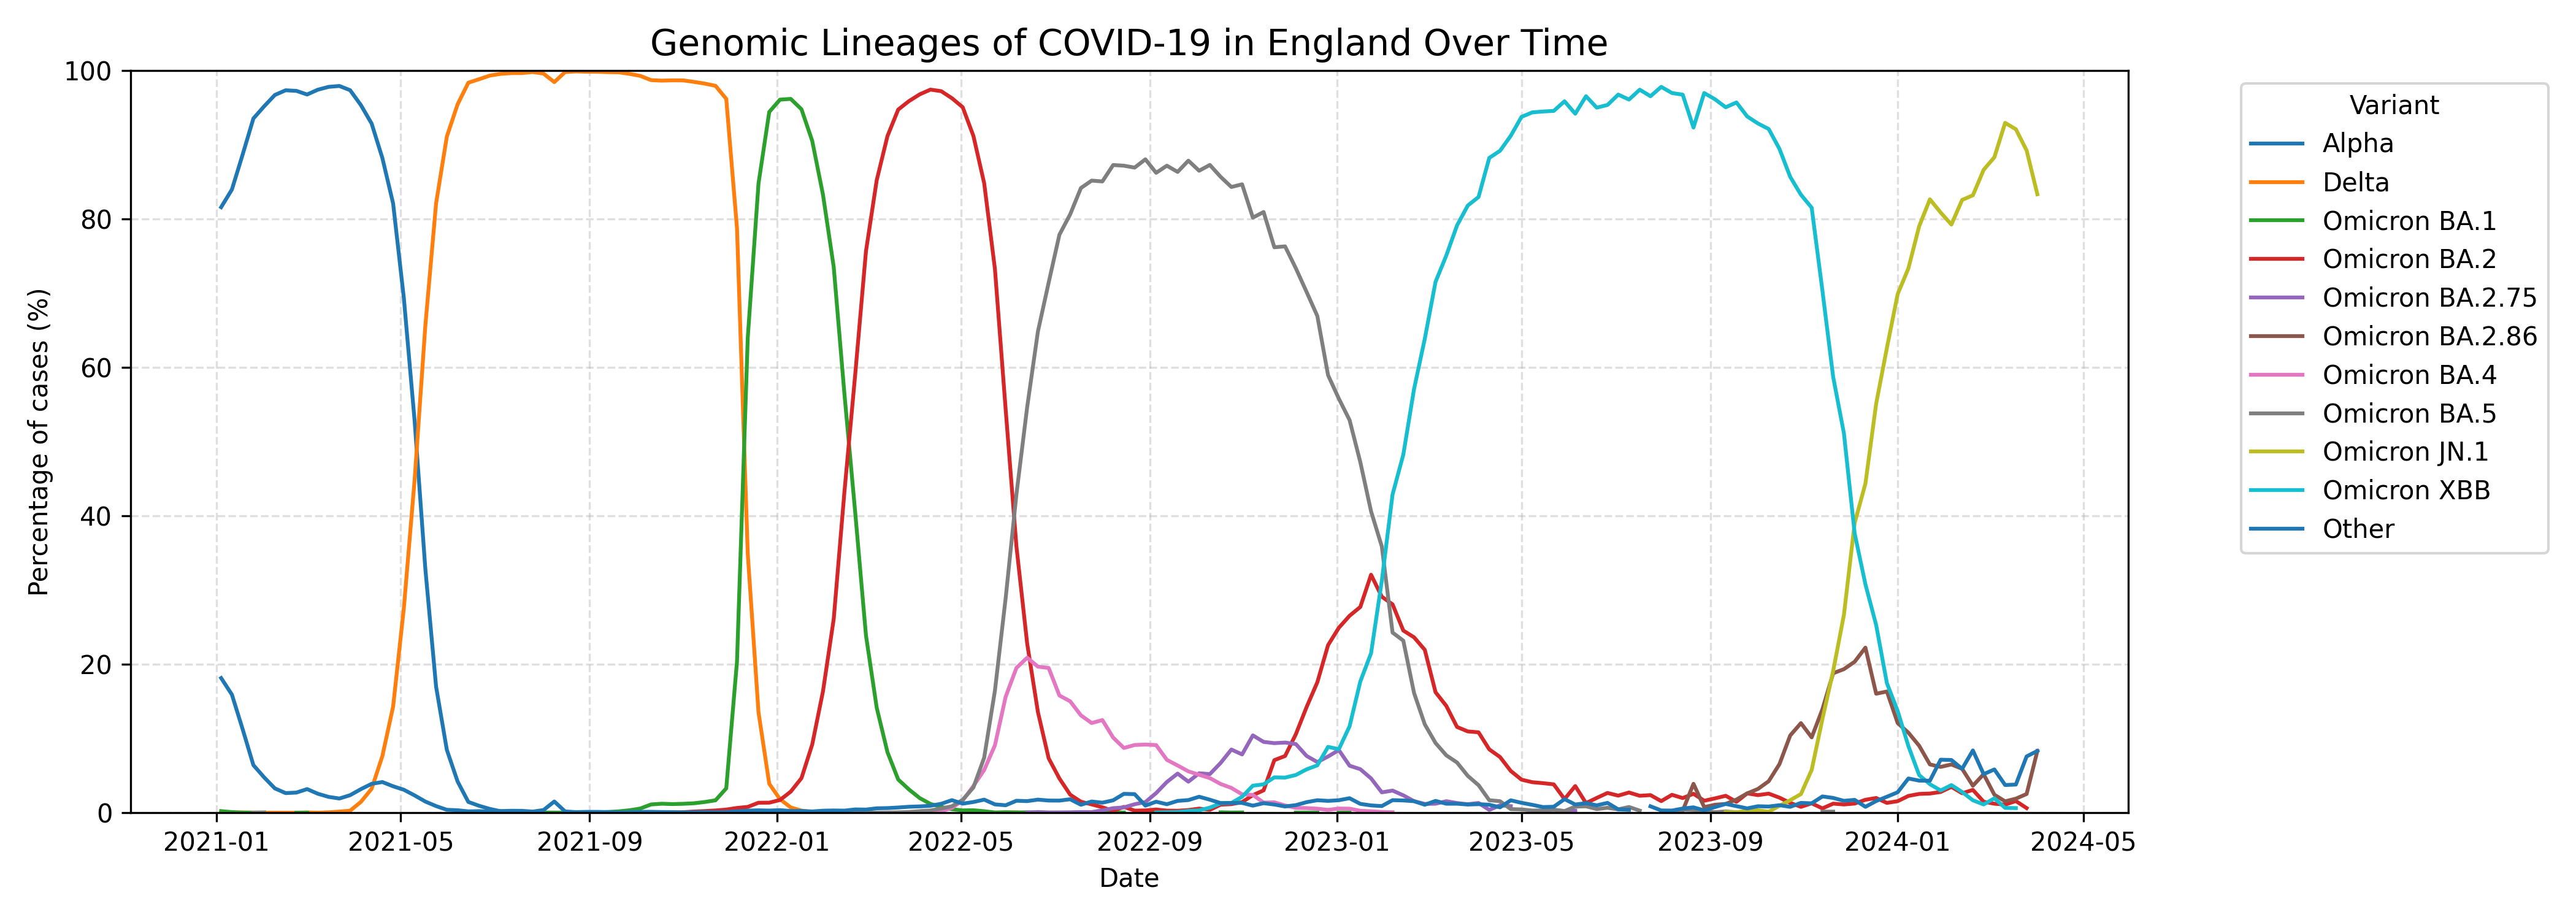
Genomic Lineages of COVID-19 in England Over Time
The chart illustrates the development and distribution of genomic lineages of the SARS-CoV-2 virus (COVID-19) in England over time. The X-axis represents dates or weeks, while the Y-axis shows the percentage different viral genetic lineages.
Differet colors or segments highlight the major variants and subvariants of COVID-19, such as Alpha, Delta, Omicron, and their respective sub-lineages, which dominated during successive waves of the pandemic.
The chart reveals how specific lineages emerged, spread, and eventually replaced earlier variants, reflecting the virus's evolution and its ability to adapt..
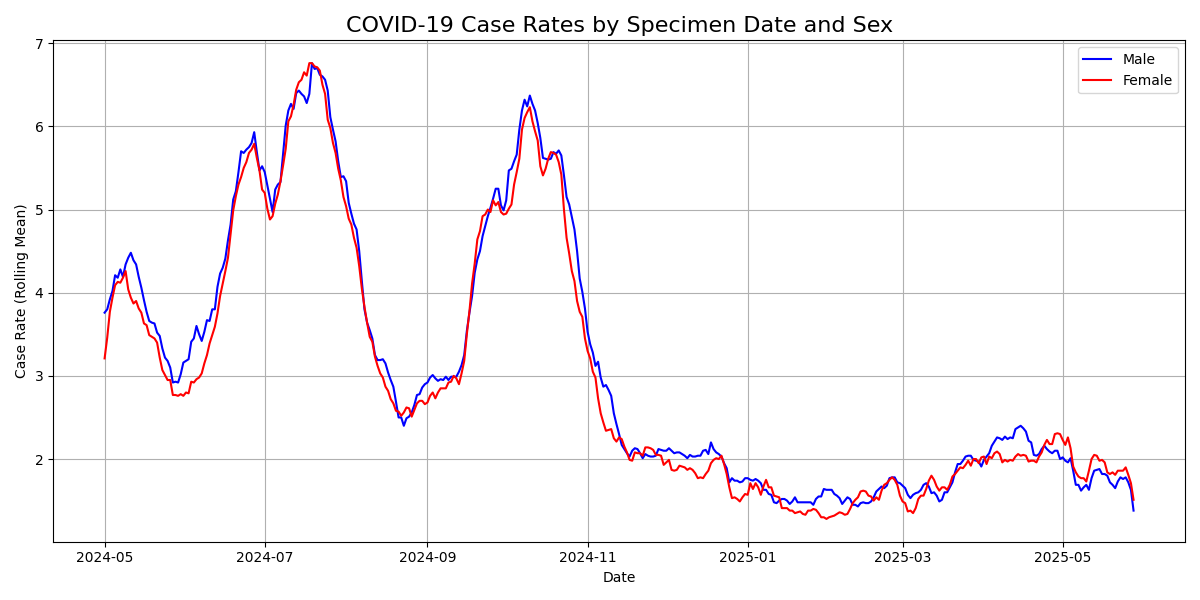
COVID-19 Case Rates by Specimen Date and Sex
Comparison of case rates between male and female populations.
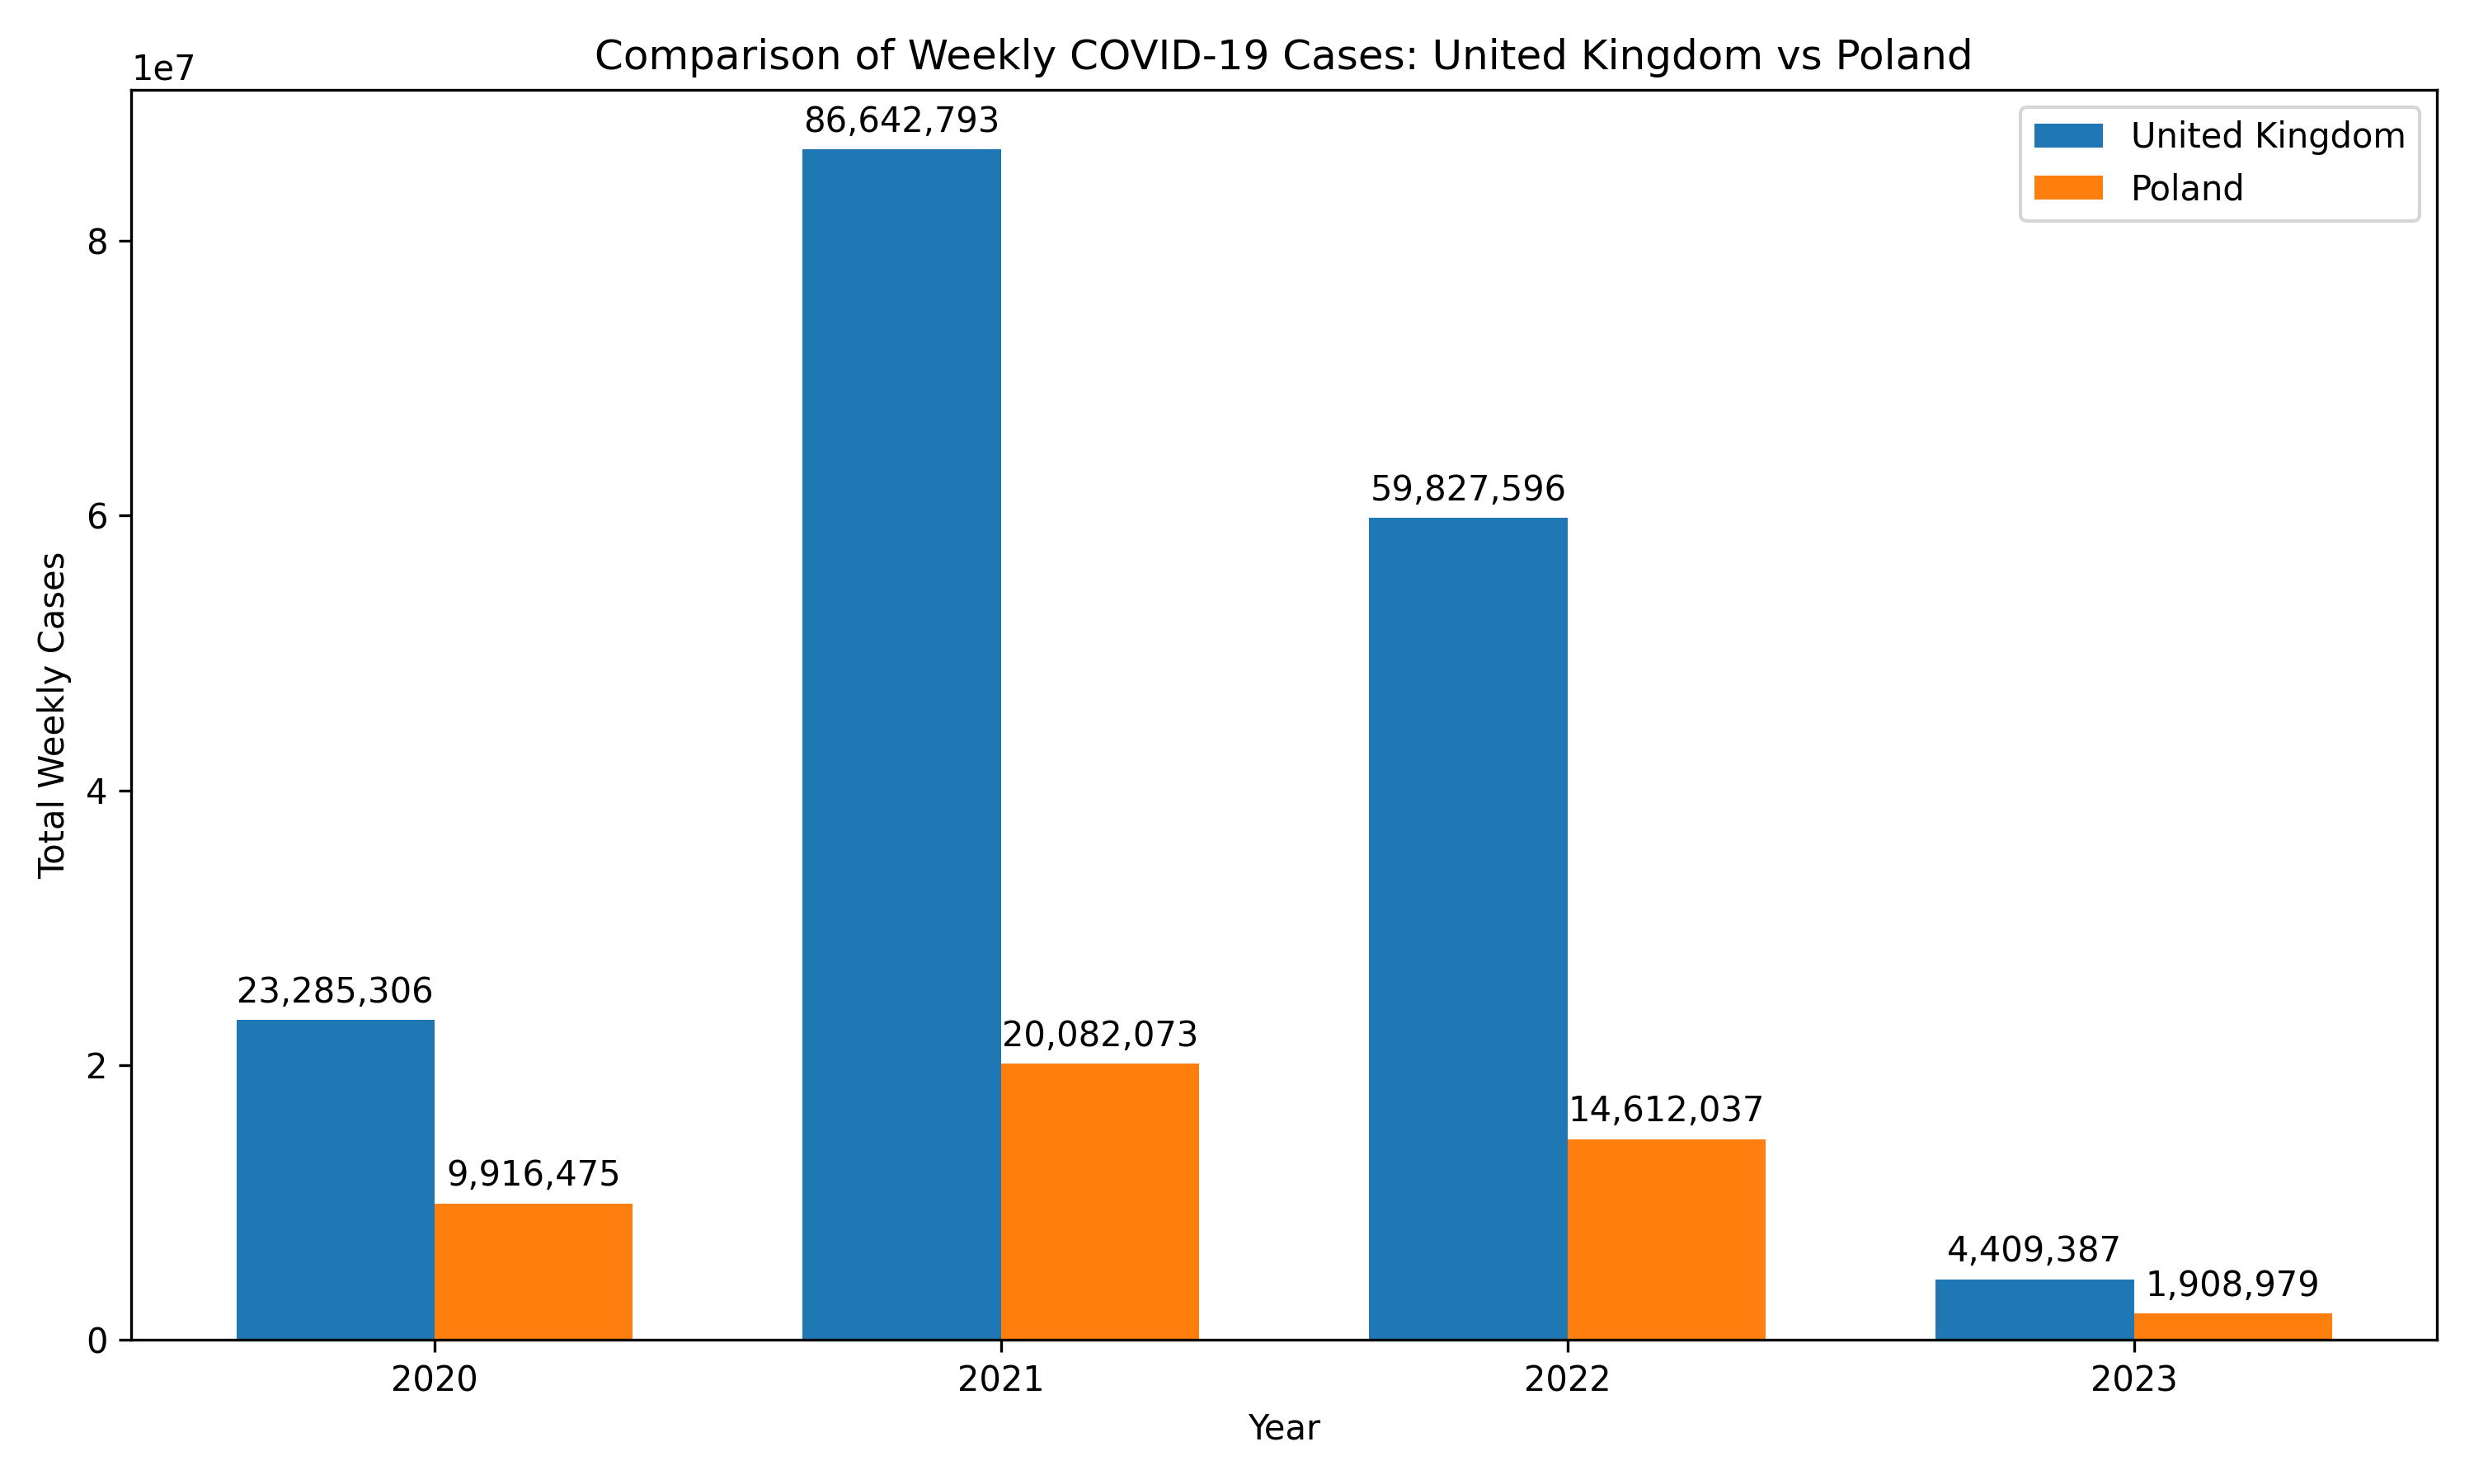
Comparison of weekly COVID-19 CASES: UK vs PL
The chart illustrates a comparison of weekly reported COVID-19 cases between the United Kingdom (UK) and Poland (PL) over a given period.
COVID-19 Daily Cases by Local Authority 2021
Geographic distribution of COVID-19 cases across local authorities.
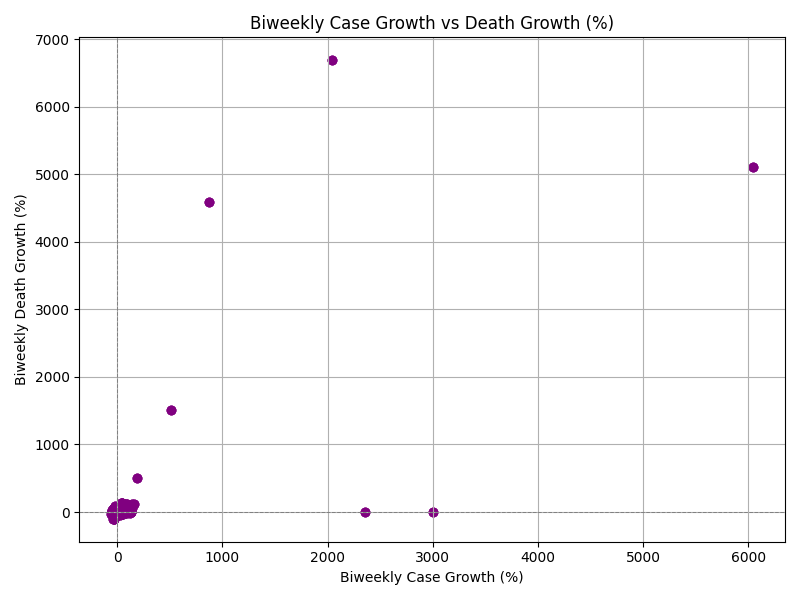
Biweekly Case Growth vs Death Growth
Scatter plot showing relationship between case and death growth rates.
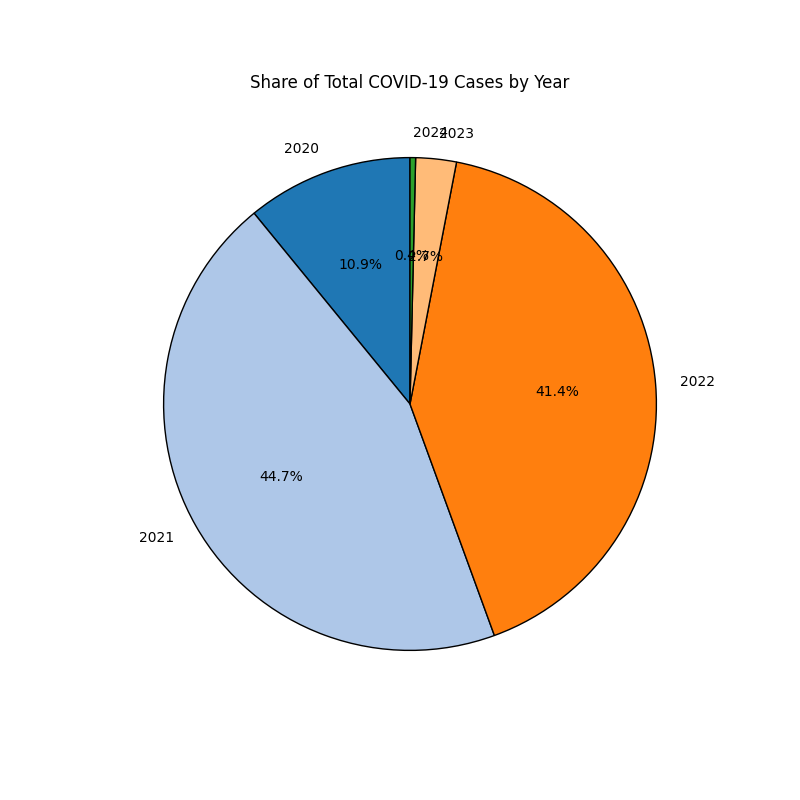
Share of Total COVID-19 Cases by Year
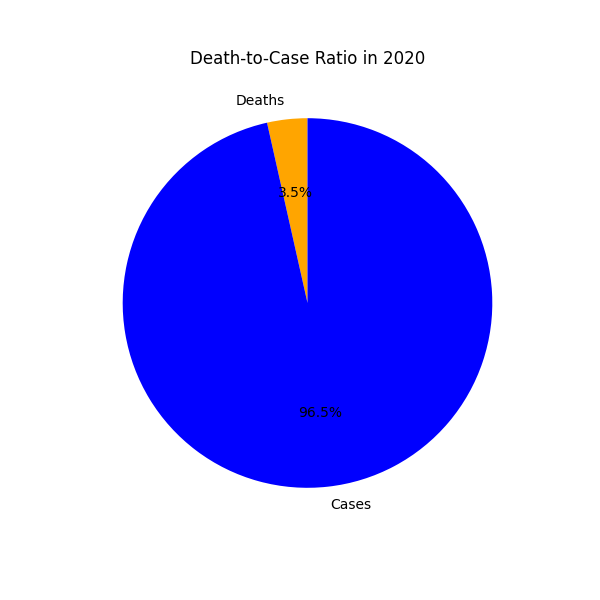
Death to Case Ratio in 2020
This pie chart illustrates the proportion of COVID-19 cases that resulted in death in the United Kingdom in 2020. A small fraction of all confirmed cases led to death, while the vast majority were non-fatal. This visualization provides a quick overview of the case fatality ratio during that year.
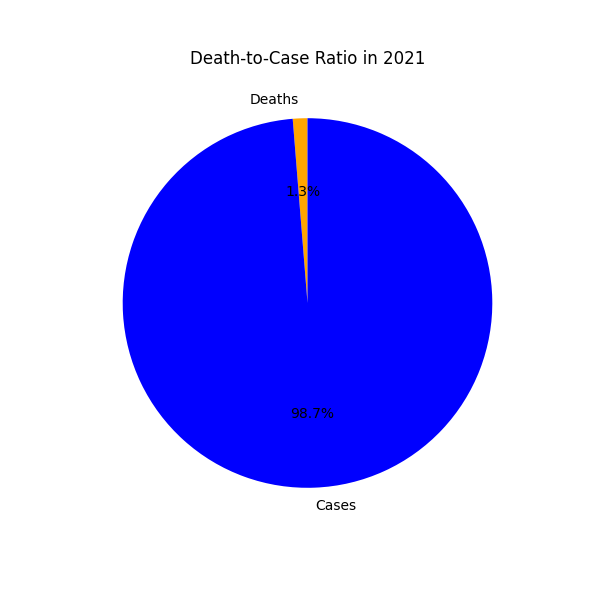
Death to Case Ratio in 2021
This pie chart illustrates the proportion of COVID-19 cases that resulted in death in the United Kingdom in 2021. A small fraction of all confirmed cases (1.3%) led to death, while the vast majority (98.7%) were non-fatal. This visualization provides a quick overview of the case fatality ratio during that year.
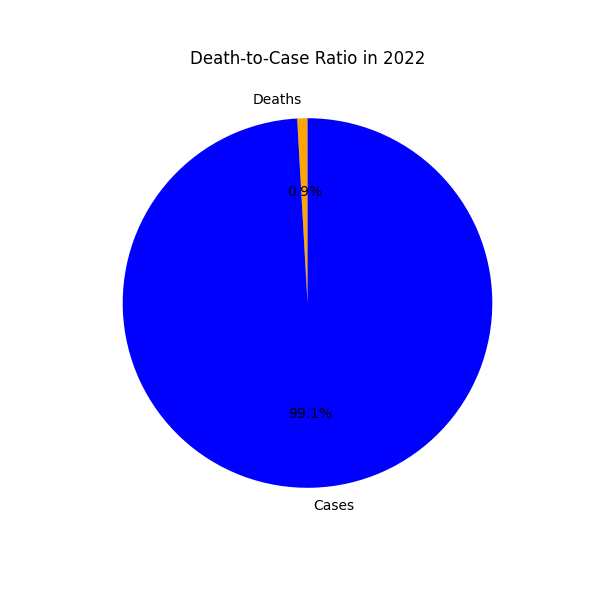
Death to Case Ratio in 2022
This pie chart illustrates the proportion of COVID-19 cases that resulted in death in the United Kingdom in 2022. A small fraction of all confirmed cases led to death, while the vast majority were non-fatal. This visualization provides a quick overview of the case fatality ratio during that year.
Death to Case Ratio in 2023
This pie chart illustrates the proportion of COVID-19 cases that resulted in death in the United Kingdom in 2023. A small fraction of all confirmed cases led to death, while the vast majority were non-fatal. This visualization provides a quick overview of the case fatality ratio during that year.

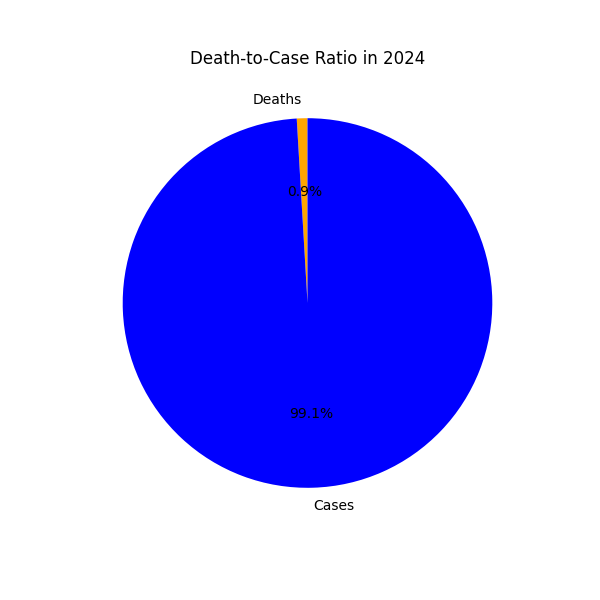
Death to Case Ratio in 2024
This pie chart illustrates the proportion of COVID-19 cases that resulted in death in the United Kingdom in 2024. A small fraction of all confirmed cases led to death, while the vast majority were non-fatal. This visualization provides a quick overview of the case fatality ratio during that year.
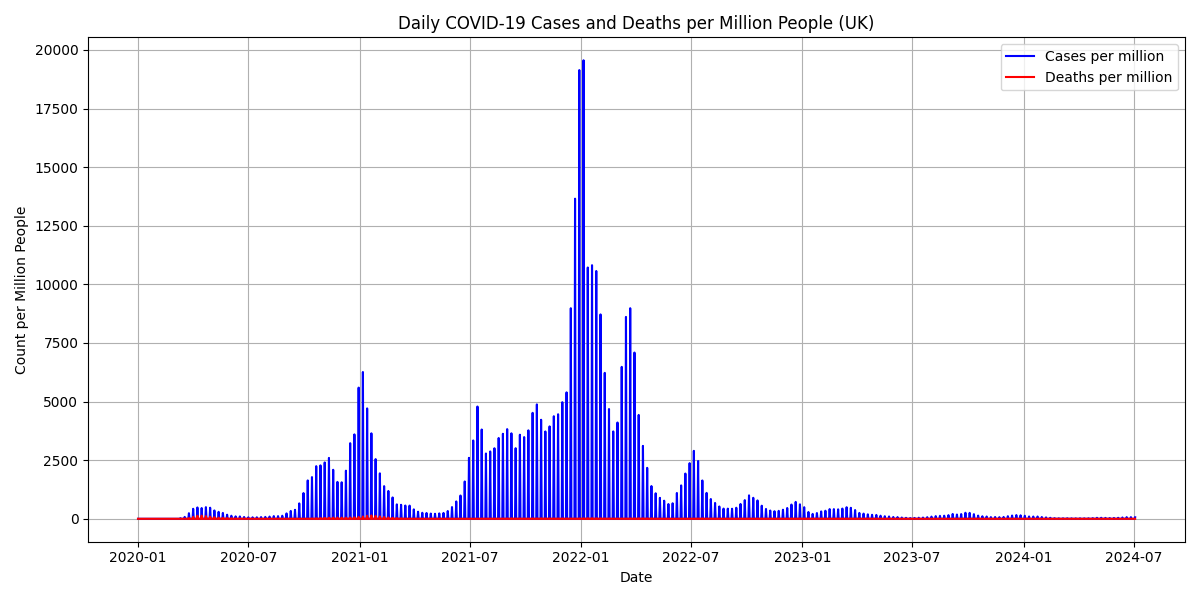
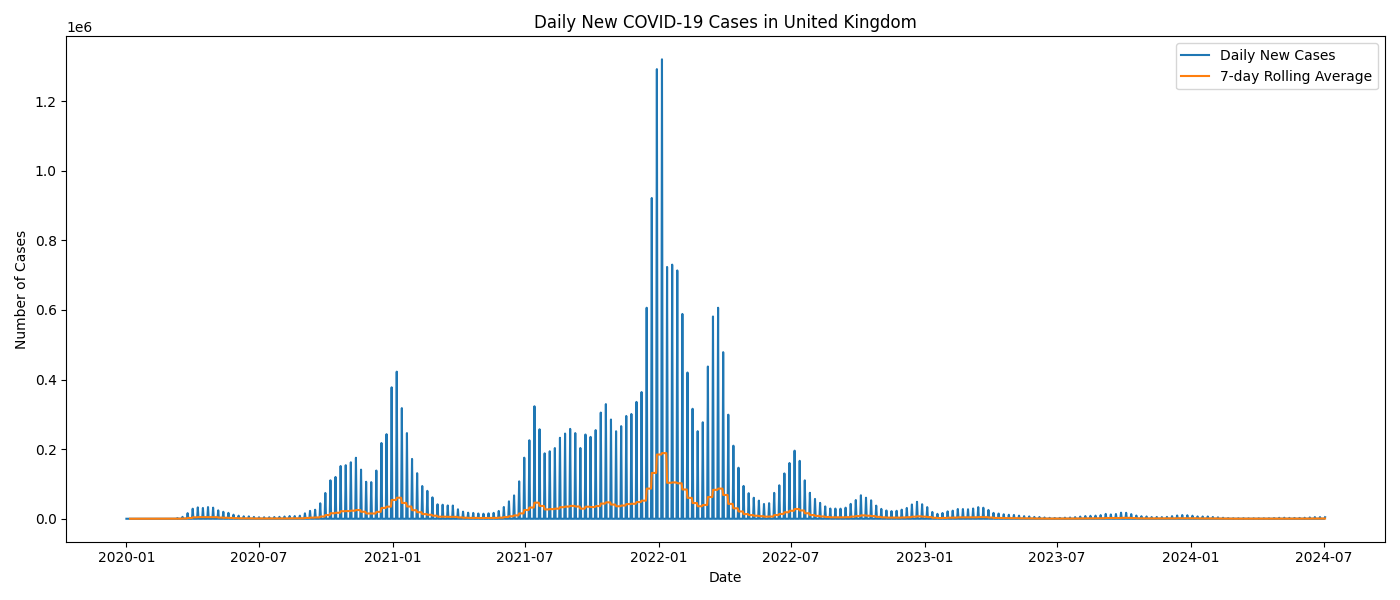
Daily New COVID-19 Cases in UK
This chart illustrates the number of daily new COVID-19 cases in the United Kingdom from early 2020 to mid-2024. The blue bars represent the daily case counts, while the orange line shows the 7-day rolling average, which helps highlight broader trends and smooth out daily fluctuations.
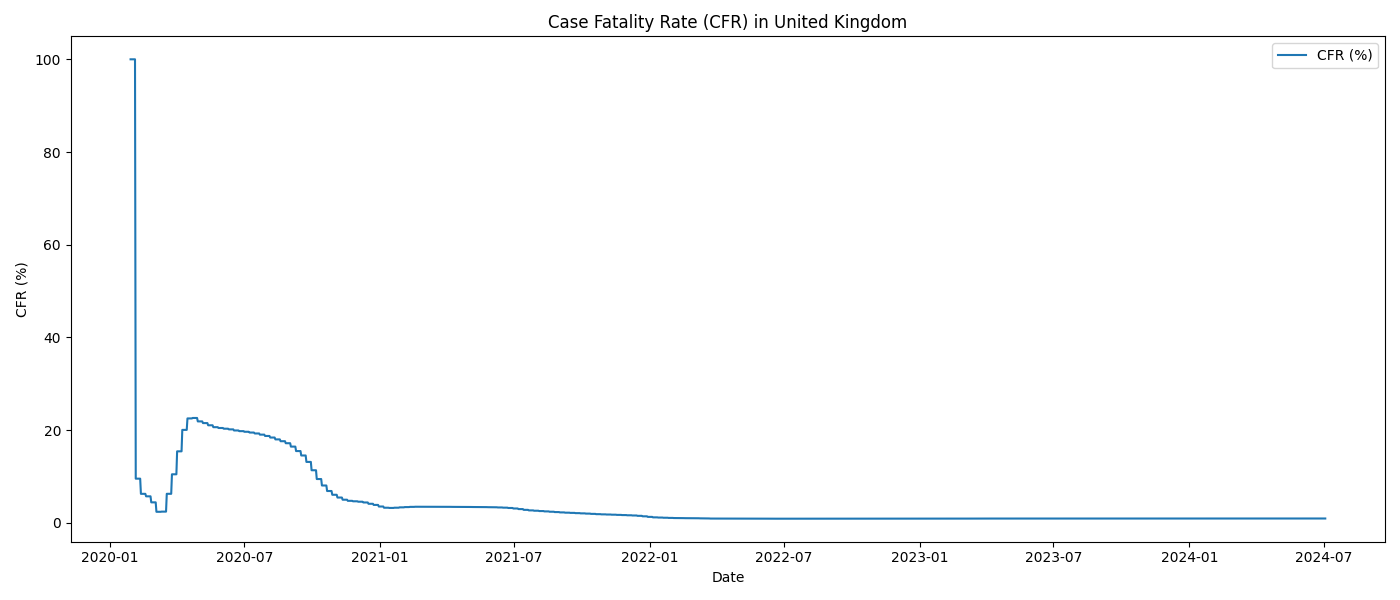
Case Fatality Rate (CFR) in UK
Overall case fatality rate showing share of deaths among confirmed cases.
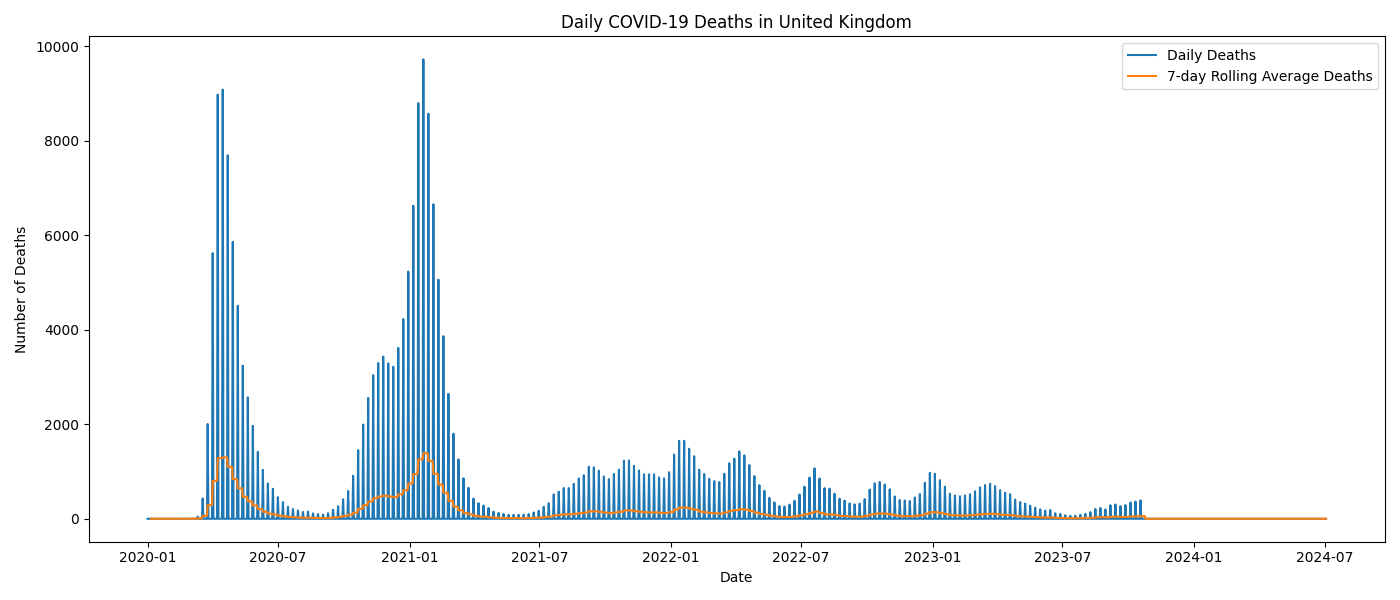
Daily COVID-19 Deaths in UK
Several distinct waves of increased deaths can be observed, typically corresponding to major COVID-19 surges. These peaks often occur a few weeks after spikes in case numbers, reflecting the lag between infection and severe outcomes. The highest death counts generally align with the most severe phases of the pandemic, such as the winter of 2020/2021 or the emergence of variants like Delta or Omicron.
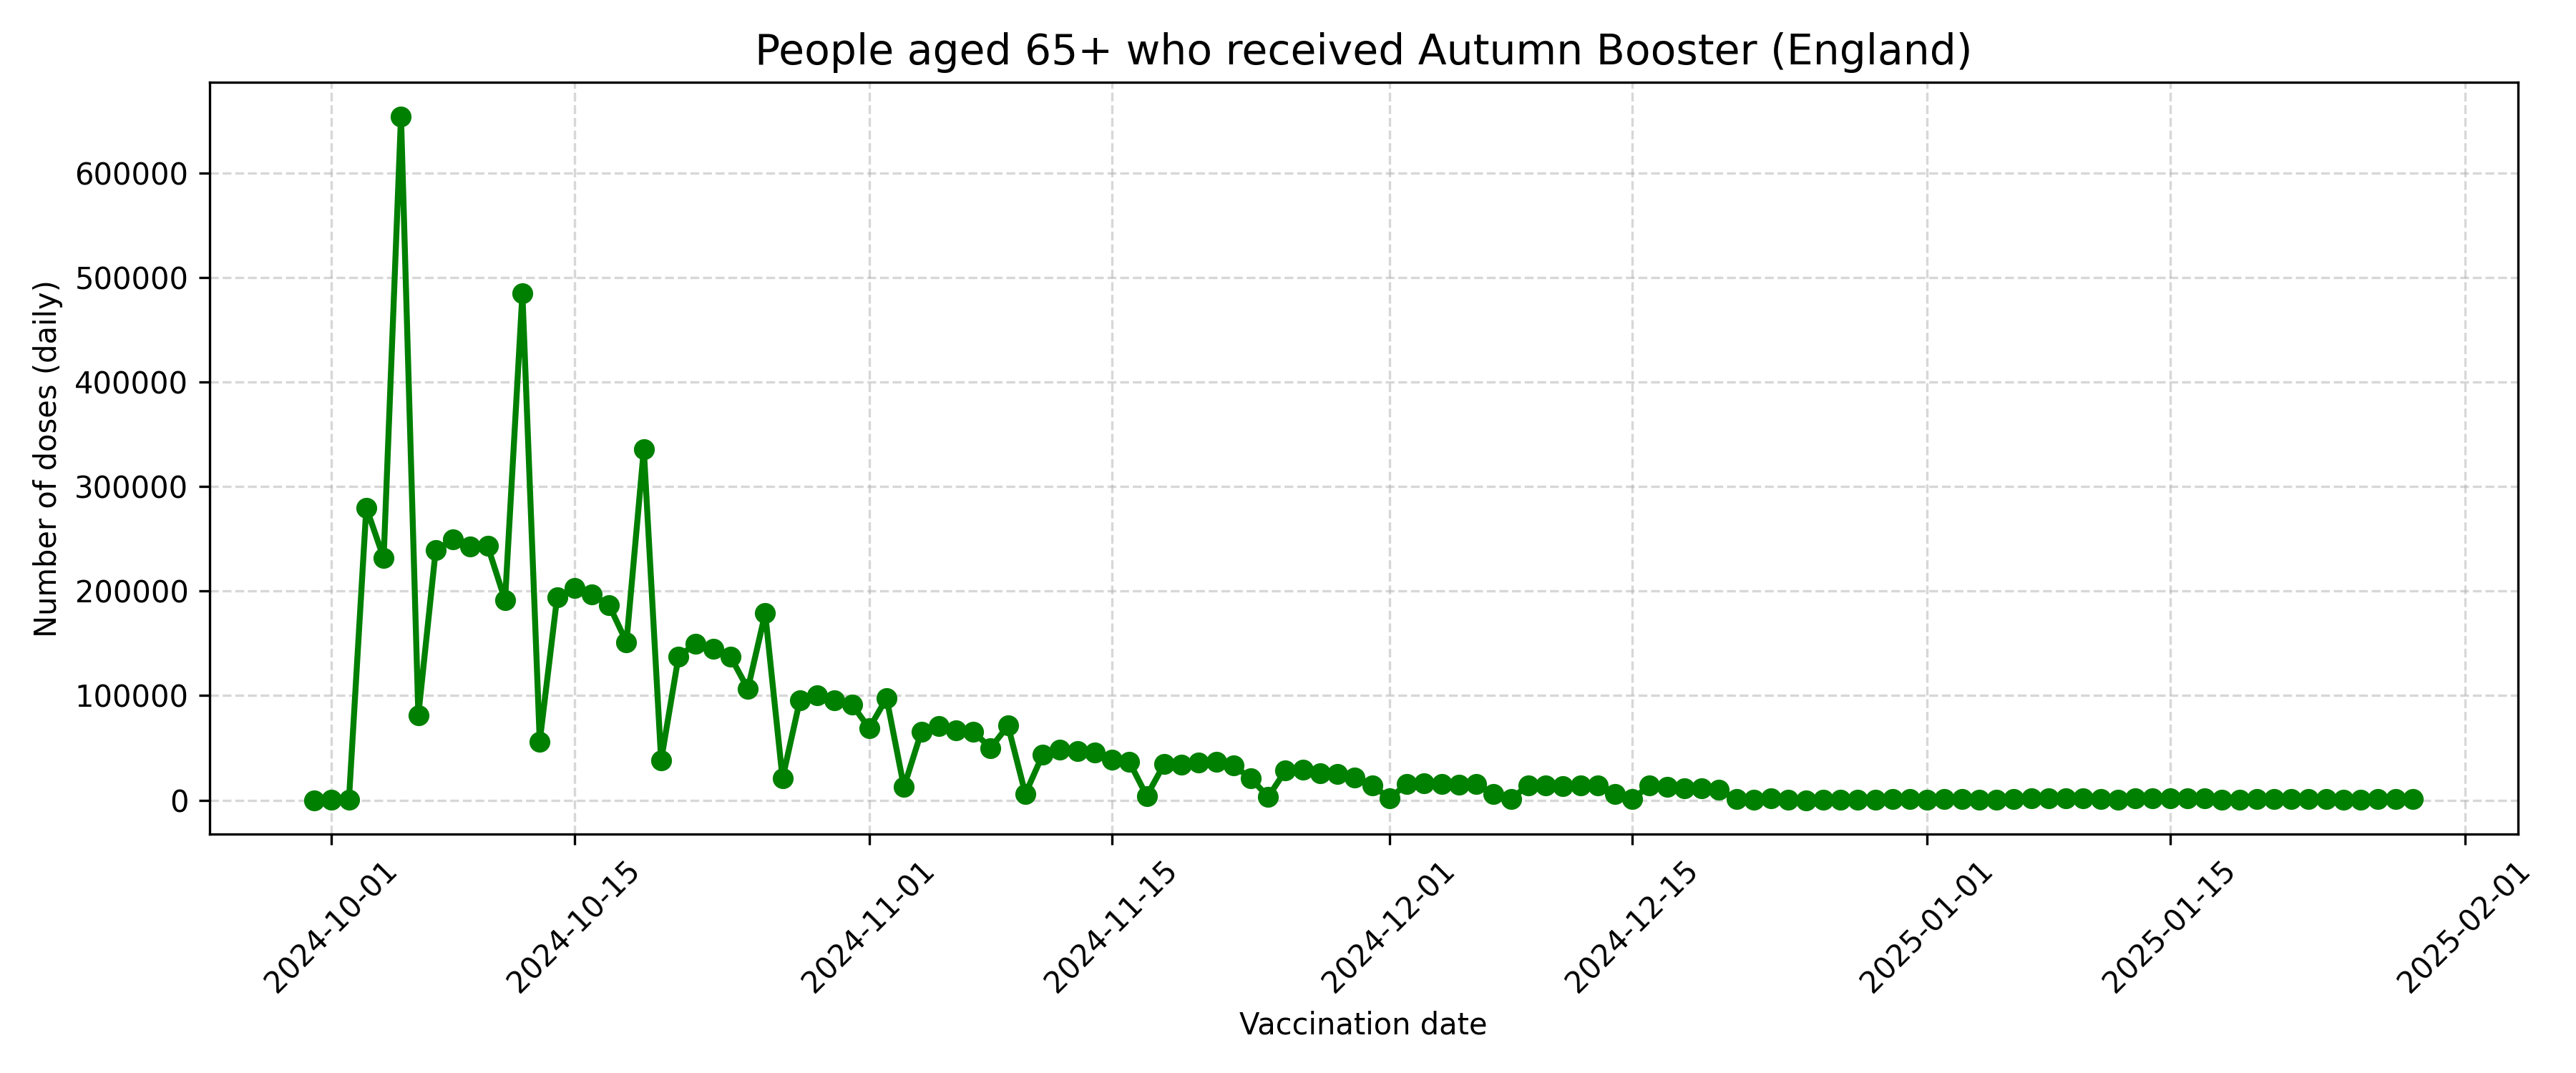
People aged 65+ who received Autumn Booster in UK
This chart displays the daily number of COVID-19 autumn booster doses administered to people aged 65 and over in England, spanning from late September 2024 to the end of January 2025.
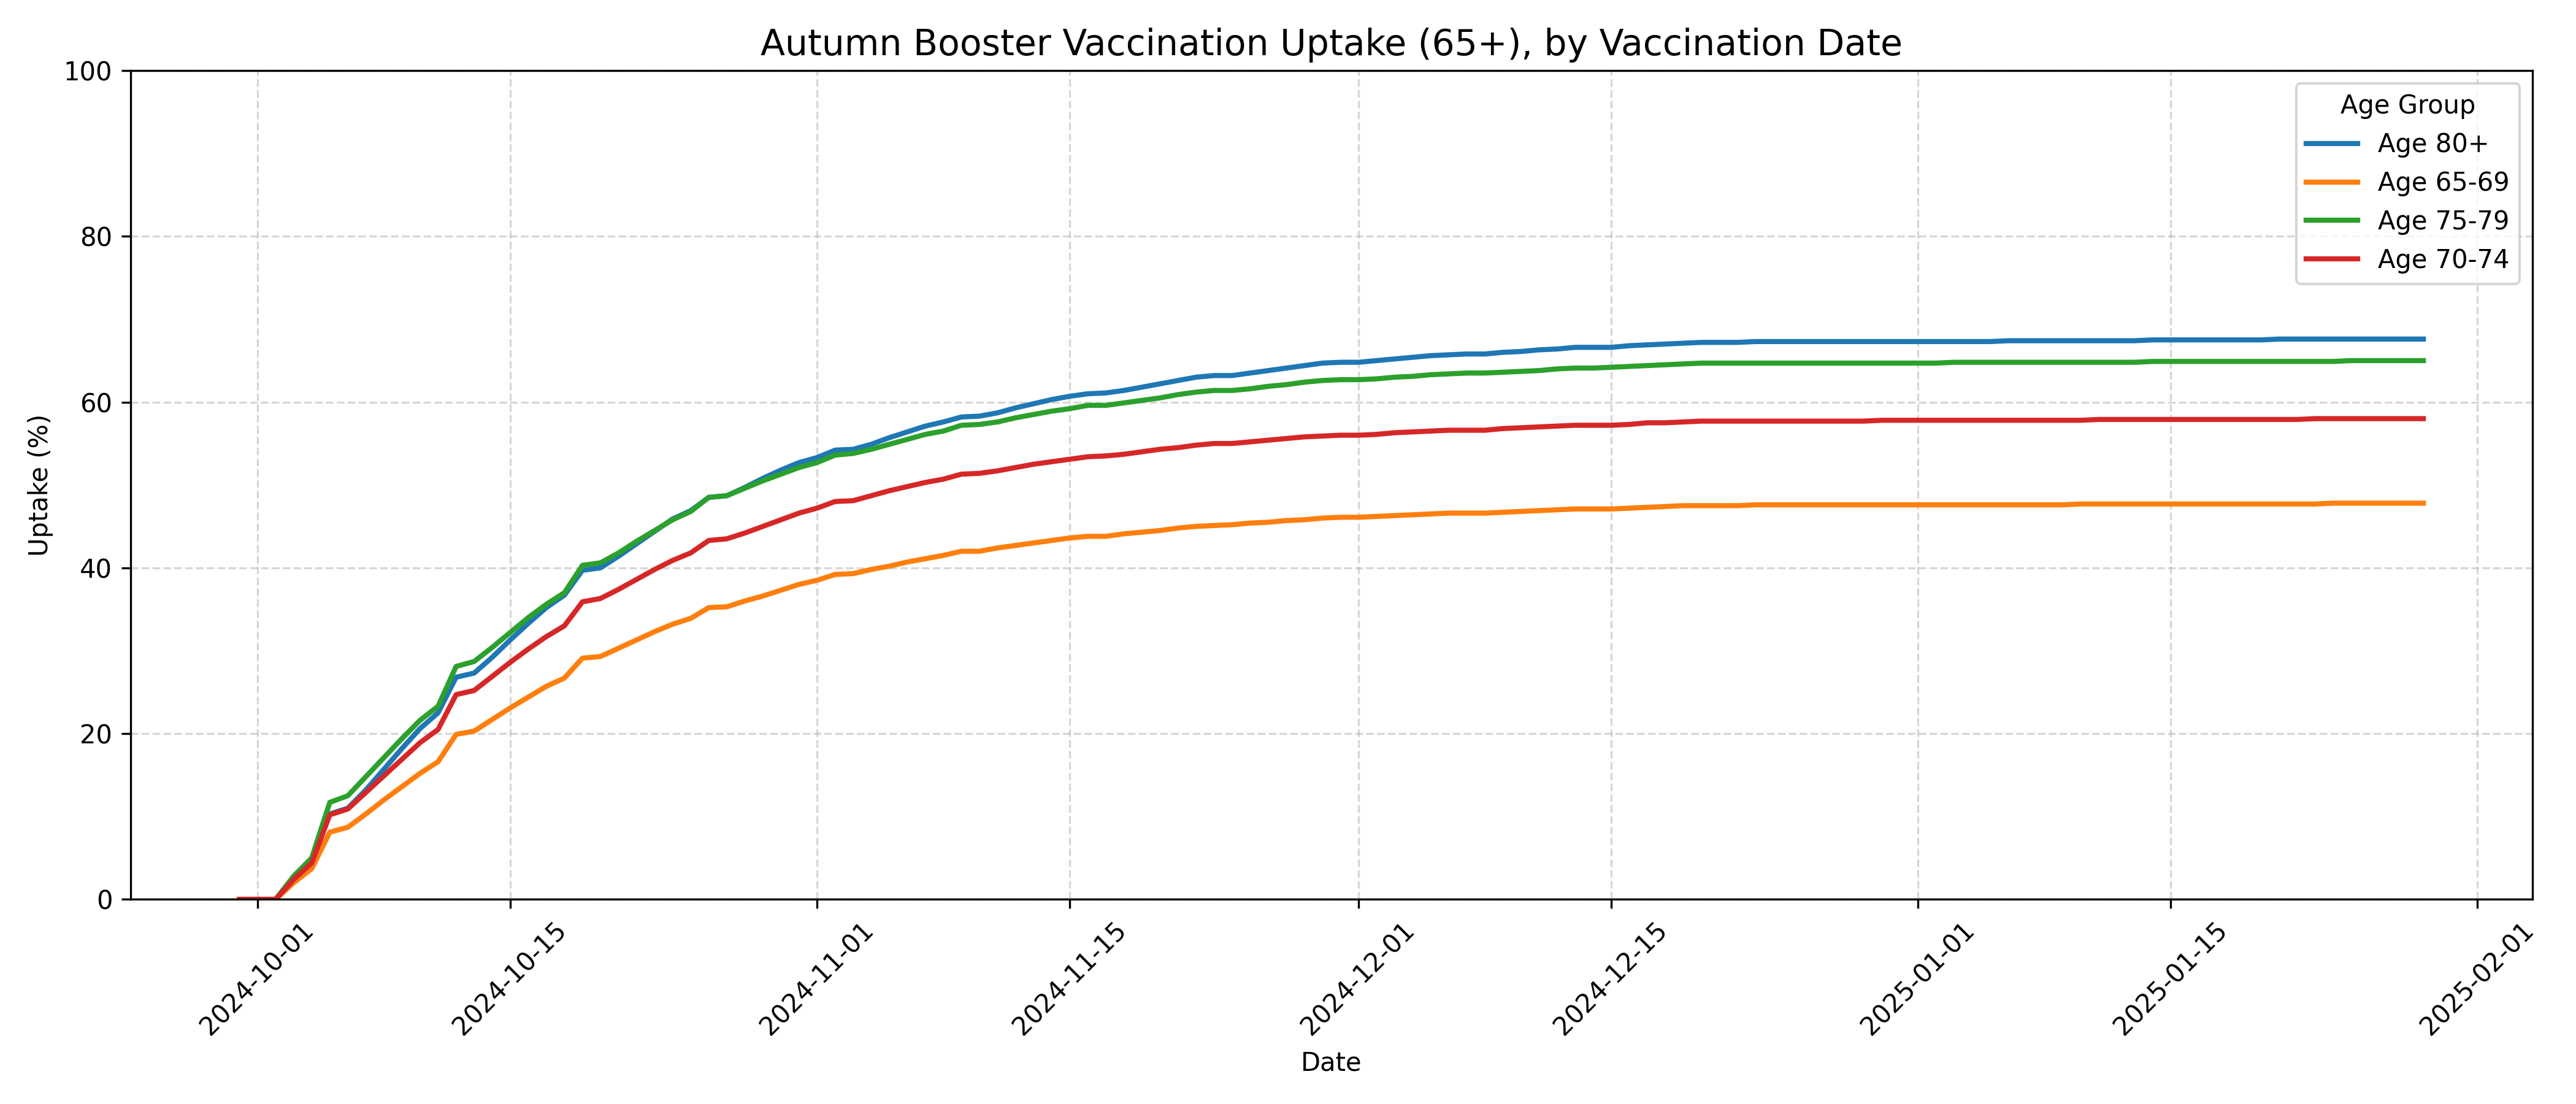
Autumn Booster Vaccination Uptake (65+) by Vaccination Date
The chart shows the number of individuals aged 65 and older who received a booster dose of the COVID-19 vaccine as part of the autumn vaccination campaign, broken down by vaccination dates.
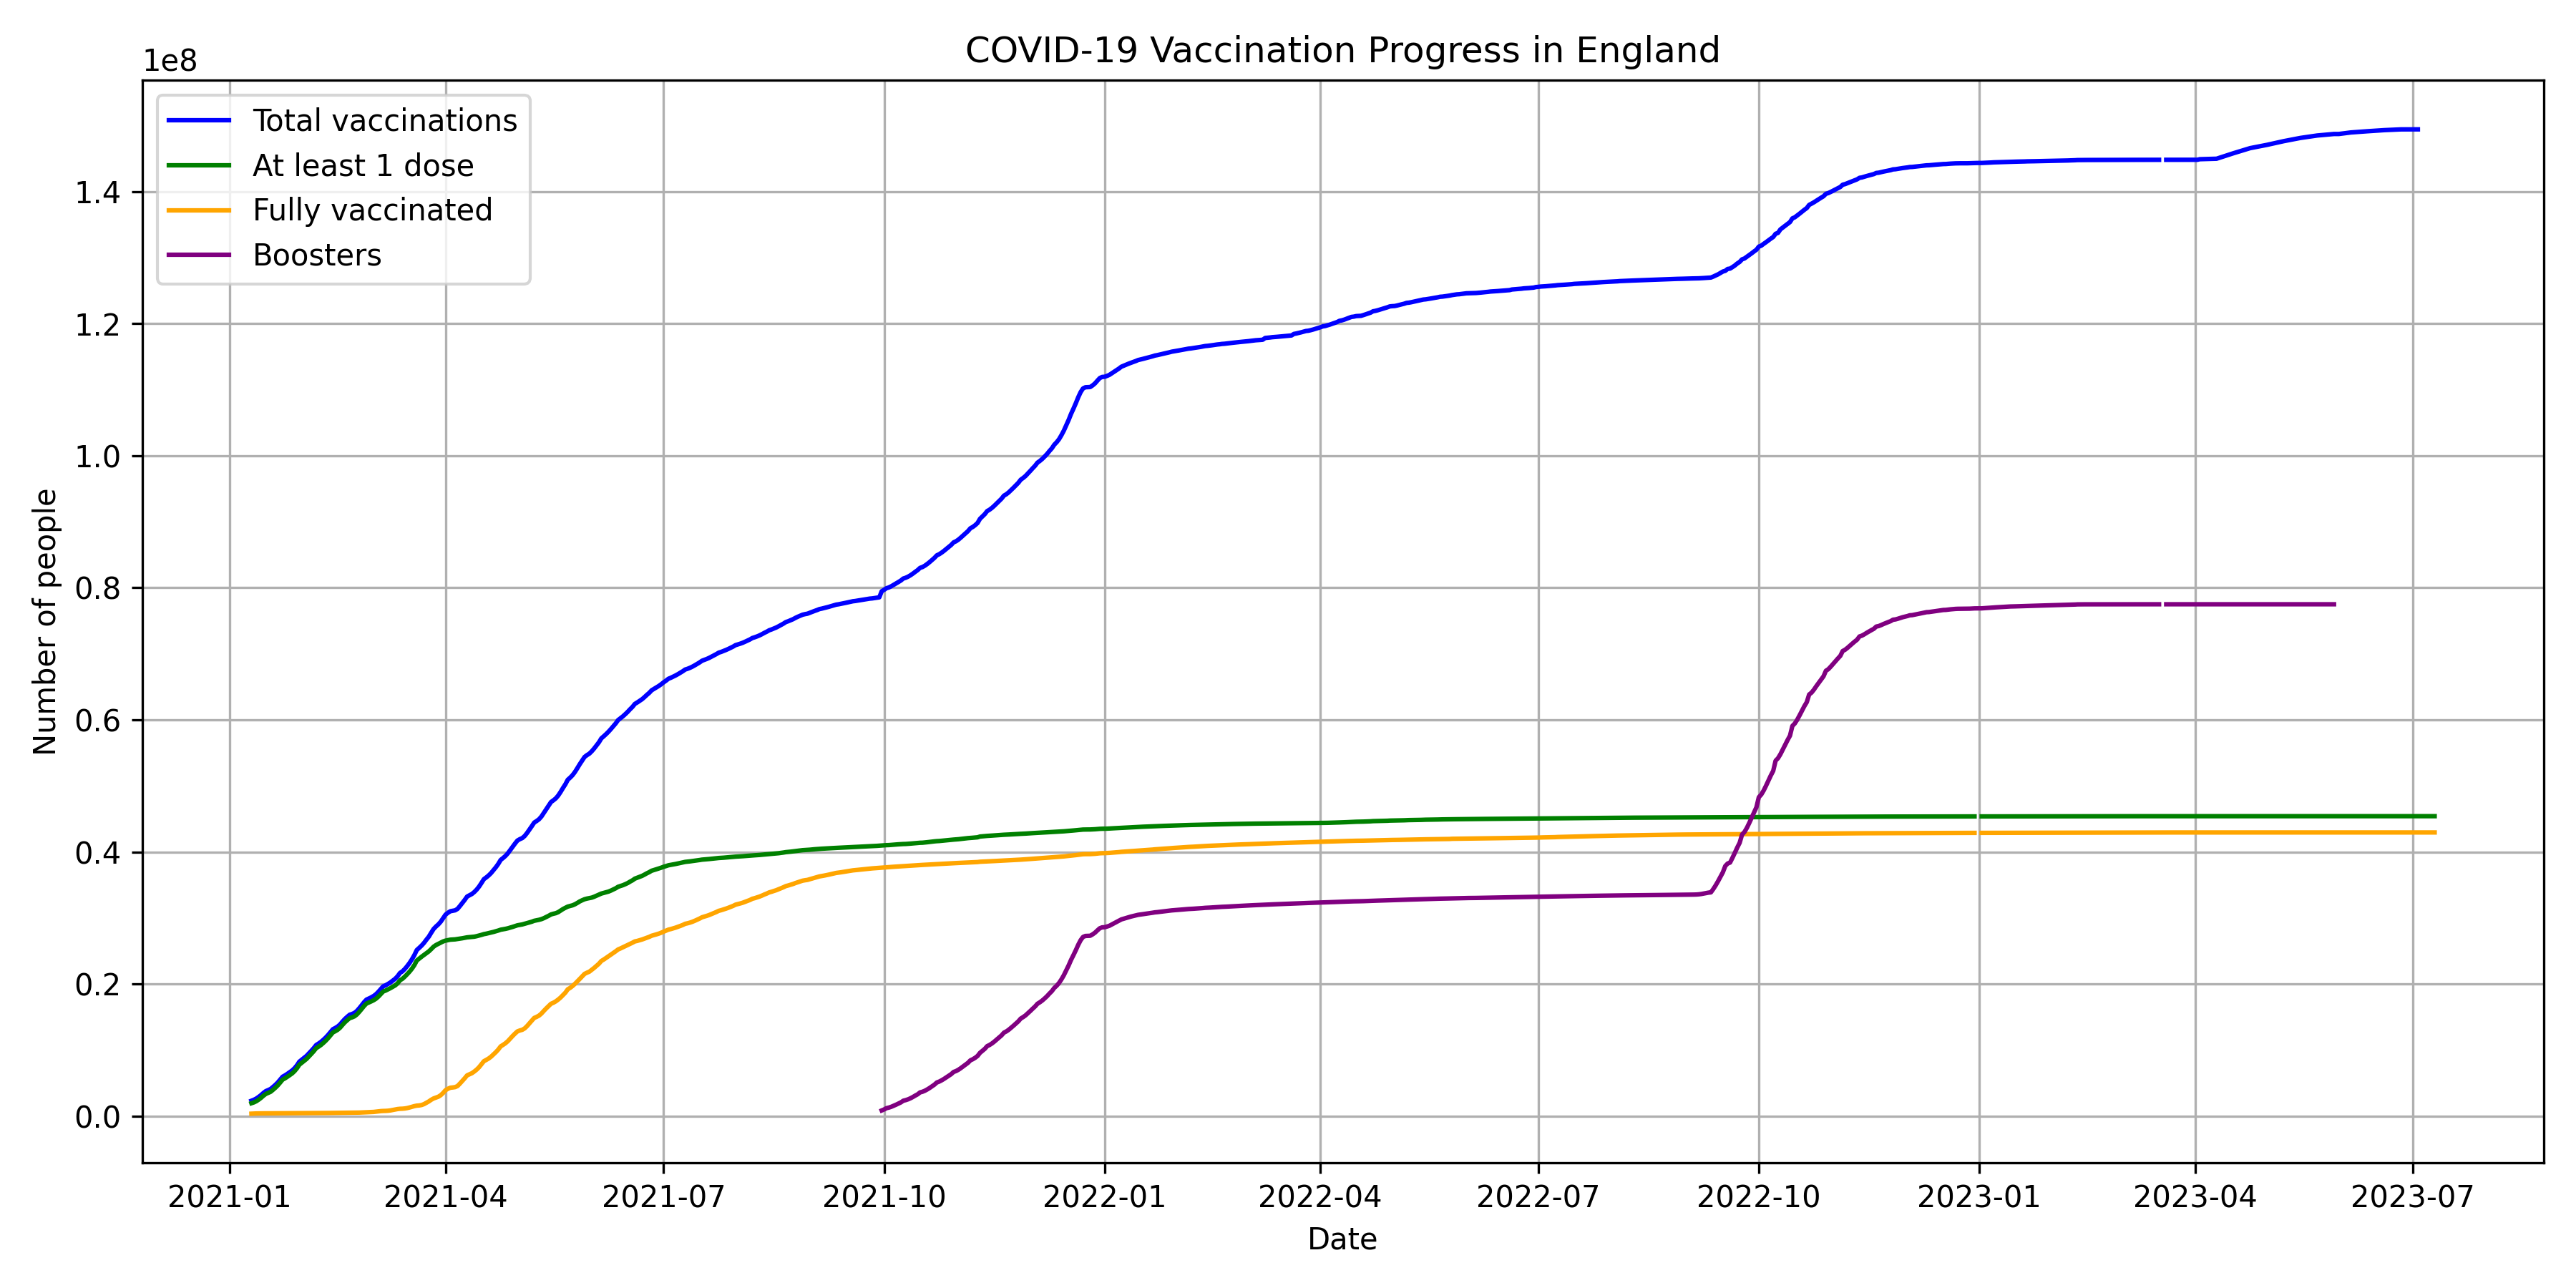
COVID-19 Vaccination Progress in England
The chart shows the progress of COVID-19 vaccinations in England over time. First dose – representing people who have started the vaccination cycle, Second dose – fully vaccinated individuals, Booster dose – people who have received an additional dose to boost their immunity.
COVID-19 Vaccination Progress in England