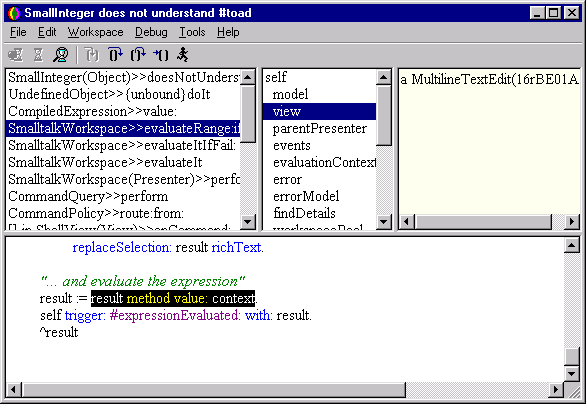

The Dolphin Debugger allows you inspect the state of a process, and to step through your own code and that of the system. After an error Walkback occurs you can use it to determine the cause by peering down through the stack looking at the values of temporary and other variables. It can also be used to step through, or continue the execution of, a process following a resumable exception (such as that caused by encountering a hard coded breakpoint (#halt message), or pressing Ctrl+Break).

The Debugger has four panes, from top left and clockwise: The Stack Trace, the Variables pane, the Variable Value pane, and the Source Workspace.
The Stack Trace shows the stack of method and block activations currently pending in the process stack. The display is the same as that in a Walkback. By default the list does not necessarily include all the stack frames, so the depth of the trace can be expanded with the Debug/Call Stack/More and Debug/Call Stack/All commands. Selecting a frame in the stack trace causes the other panes to be updated with relevant information.
The Variables pane shows a list of the names of the temporaries in scope at the current execution position in the selected stack frame. The list also includes the receiver of the message, 'self' and its instance variables. Sometimes it will also include additional unnamed stack variables identified as 'stack[N]' where N is the distance from the top of the stack. Typically when about to return from a method stack[0] will show the value that will be returned.
When a variable is selected in the Variables pane the Variable Value pane is updated to show the #printString (a short debug description) of the object assigned to the variable. A full Inspector can be opened on the selected variable using the Variables pane's context menu.
The Source pane shows the source code of the method associated with the current stack frame. The Debugger highlights the text of the expression in the method which is currently being executed, unless the top stack frame is selected, in which case it highlights the text of the expression which is about to be executed. Although this inconsistency seems confusing at first glance, it seems natural when using the Debugger to step through code.
Tip: It is possible to edit the code of the method in the Source pane and save it using Workspace/Accep. However, you should be aware that this will not replace the old instance of the method that is being referenced from stack frames in the process which you are debugging. Consequently, when you save the change, the Debugger Source pane does not refresh but, instead, the method will be marked as "unbound" in the Stack Trace. Any step operations will continue through the code of the old method.
Normally, the Debugger will be launched as the result of a Walkback. If, however, you wish to launch it directly then just execute self halt in any Workspace.
If you wish to set a breakpoint in a method, simply re-compile the method with self halt inserted at the required location. This will cause a "Hard coded breakpoint" Walkback to appear when the breakpoint location is reached. You can then enter the Debugger by pressing the Debug button. Don't forget to remove any inserted breakpoints following your debugging session.
Assuming that the Debugger was invoked as a result of a resumable exception, you can make use of the stepping commands to continue execution in the Debugger. These commands are Step-into, Step-over, Step-out, Run-to-cursor, Go, and Animate. The commands are available from the Debug menu, from the Stack Trace context menu, and, with the exception of the Animate command, via the accelerators F11, F10, Shift+F11, Ctrl+F10, and F5 respectively.
Tip: You can learn a lot about Dolphin by stepping though base system code in the Debugger, but be very careful when placing halt messages in base system methods. If these are used by the Debugger, you will probably cause a recursive walkback and crash the system. Save your image before doing anything you suspect might compromise the system.
When you have finished debugging a process you can either, explicitly terminate the process and close the Debugger, with the Debug/Terminate command, or alternatively just close the Debugger window and leave the system to clean up the process on the next garbage collection. Obviously if you choose to resume execution following a resumable exception then the Debugger will close of its own accord.